


Trusted by over 15 Million Traders
The Most Awarded Broker
for a Reason
Easy Access to 1,400+ Global Assets
EURUSD
Euro vs U.S. Dollar
US500
S&P 500 (US500)
GOLD
Gold
COFFEE
US Coffee
Apple
Apple (AAPL.OQ)
-

Finance Magnates 颁发
-

Finance Magnates 颁发
-

Capital Finance International Magazine (CFI.co) 2024年颁赠
-

COLWMA 2024年颁赠
-

荣获World Finance Forex Awards 2023最佳外汇客户服务奖
-

荣获World Finance Forex Awards 2023欧洲最佳外汇经纪商奖
-

荣获World Finance Forex Awards 2023澳大拉西亚最佳外汇经纪商奖
-

荣获World Finance Forex Awards 2023拉丁美洲最佳外汇经纪商奖
-

荣获World Finance Forex Awards 2023中东最佳外汇经纪商奖
-

CFI.co于2023年颁赠
-

荣获2023年City of London Wealth Management Awards
-

荣获2022年埃及金融博览会颁赠
-

荣获2022年City of London Wealth Management Awards
-

CFI.co于2022年颁赠
-

荣获Global Forex Awards 2022 — 零售外汇 颁赠
-
2021年迪拜外汇博览会获颁赠
-

Ultimate Fintech 2021年颁赠
-

荣获2021年City of London Wealth Management Awards
-

FX168于2020年12月颁赠
-

荣获Global Business Awards 2020
-

荣获2020年City of London Wealth Management Awards
-

Capital Finance International Magazine (CFI.co)颁赠
-

Capital Finance International Magazine (CFI.co)颁赠
-

荣获2019年City of London Wealth Management Awards
-

Shares Magazine 授予 UK Forex Awards 2018
-

Capital Finance International Magazine (CFI.co)颁赠
-

Capital Finance International Magazine (CFI.co)颁赠
-

2017年伦敦财富管理奖
-

2016最佳本土 客户服务
-

中东和北非地区(MENA)增长最快的经纪商
-
2015年最佳外汇科技提供商
-
2014年最佳外汇科技提供商
-

2014年最佳外汇科技提供商
-

荣获 The Trading Show 2024年非洲 Africa Fintech 峰会颁赠
-

荣获2024年中东地区 Brokersview 颁赠
-
荣获2024年中东地区 Brokersview 颁赠
-

荣获2024年阿曼 Smart Vision 峰会颁赠
-

荣获2024年迪拜外汇博览会颁赠
-

荣获2024年迪拜 Forex Traders Summit 颁赠
-

2024年埃及 Smart Vision 峰会颁赠
-

投查查于2024年颁赠
-

Capital Finance International Magazine (CFI.co) 2024年颁赠
-

CFI.co于2023年颁赠
-

CFI.co于2023年颁赠
-

交易社区平台FOLLOWME于2022年颁赠
-
2022年迪拜Forex Expo获颁赠
-
2022年迪拜Forex Expo获颁赠
-

荣获Global Forex Awards 2022 — 零售外汇 颁赠
-

CFI.co于2022年颁赠
-

CFI.co于2022年颁赠
-

World Finance Forex Awards 2022 颁发
-

World Finance Forex Awards 2022 颁发
-

World Finance Forex Awards 2022 颁发
-

World Finance Forex Awards 2022 颁发
-
交易社区平台FOLLOWME于2021年颁赠
-

2021年埃及Smart Vision Investment Expo博览会获颁赠
-

CFI.co于2021年颁赠
-

CFI.co于2021年颁赠
-

荣获Global Forex Awards 2021 — 零售外汇 颁赠
-

荣获Global Forex Awards 2021 — 零售外汇 颁赠
-

World Finance 2021颁发
-

World Finance 2021颁发
-
FOLLOWME于2021年颁赠
-

Global Forex Awards 2021 — B2B 颁赠
-

Global Forex Awards颁赠
-

Global Forex Awards颁赠
-

CFI.co于2020年颁赠
-

CFI.co于2020年颁赠
-

荣获Global Business Awards 2020
-

World Finance Magazine 颁赠
World Finance Forex Awards 2020 -

World Finance Magazine 颁赠
World Finance Forex Awards 2020 -
FOLLOWME交易社区授予
-

Global Forex Awards颁赠
-

Global Forex Awards颁赠
-

FinTech Age Awards颁发
-

World Finance Magazine 颁赠
World Finance Forex Awards 2019 -

World Finance Magazine 颁赠
World Finance Forex Awards 2019 -

荣获 World Finance Forex Awards 2018 颁赠
-

荣获2018年埃及金融博览会颁赠
-

荣获 Shares Magazine 的 UK Forex Awards 2017 颁赠
-

荣获 World Finance Forex Awards 2017
-

2016年最佳黄金经纪商
-

2016年最佳外汇经纪商
-

2015年最佳本地客户服务
-

Global Brands Magazine 颁赠
-

Online Money Awards 2022 颁发
-

荣获2022年埃及金融博览会颁赠
-

2015最佳外汇交易平台
-

2015最佳金融交易平台
-

2013最佳创新外汇平台奖
-

2020年 Cyprus HR Awards 颁赠
-

金融行业的佼佼者
-

认证最优金牌级别
-

2014年首届亚军
-
Finance Magnates 颁发
-
Finance Magnates 颁发
-
Capital Finance International Magazine (CFI.co) 2024年颁赠
-
COLWMA 2024年颁赠
-
荣获World Finance Forex Awards 2023最佳外汇客户服务奖
-
荣获World Finance Forex Awards 2023欧洲最佳外汇经纪商奖
-
荣获World Finance Forex Awards 2023澳大拉西亚最佳外汇经纪商奖
-
荣获World Finance Forex Awards 2023拉丁美洲最佳外汇经纪商奖
-
荣获World Finance Forex Awards 2023中东最佳外汇经纪商奖
-
CFI.co于2023年颁赠
-
荣获2023年City of London Wealth Management Awards
-
荣获2022年埃及金融博览会颁赠
-
荣获2022年City of London Wealth Management Awards
-
CFI.co于2022年颁赠
-
荣获Global Forex Awards 2022 — 零售外汇 颁赠
-
2021年迪拜外汇博览会获颁赠
-
Ultimate Fintech 2021年颁赠
-
荣获2021年City of London Wealth Management Awards
-
FX168于2020年12月颁赠
-
荣获Global Business Awards 2020
-
荣获2020年City of London Wealth Management Awards
-
Capital Finance International Magazine (CFI.co)颁赠
-
Capital Finance International Magazine (CFI.co)颁赠
-
荣获2019年City of London Wealth Management Awards
-
Shares Magazine 授予 UK Forex Awards 2018
-
Capital Finance International Magazine (CFI.co)颁赠
-
Capital Finance International Magazine (CFI.co)颁赠
-
2017年伦敦财富管理奖
-
2016最佳本土 客户服务
-
中东和北非地区(MENA)增长最快的经纪商
-
2015年最佳外汇科技提供商
-
2014年最佳外汇科技提供商
-
2014年最佳外汇科技提供商
-
荣获 The Trading Show 2024年非洲 Africa Fintech 峰会颁赠
-
荣获2024年中东地区 Brokersview 颁赠
-
荣获2024年中东地区 Brokersview 颁赠
-
荣获2024年阿曼 Smart Vision 峰会颁赠
-
荣获2024年迪拜外汇博览会颁赠
-
荣获2024年迪拜 Forex Traders Summit 颁赠
-
2024年埃及 Smart Vision 峰会颁赠
-
投查查于2024年颁赠
-
Capital Finance International Magazine (CFI.co) 2024年颁赠
-
CFI.co于2023年颁赠
-
CFI.co于2023年颁赠
-
交易社区平台FOLLOWME于2022年颁赠
-
2022年迪拜Forex Expo获颁赠
-
2022年迪拜Forex Expo获颁赠
-
荣获Global Forex Awards 2022 — 零售外汇 颁赠
-
CFI.co于2022年颁赠
-
CFI.co于2022年颁赠
-
World Finance Forex Awards 2022 颁发
-
World Finance Forex Awards 2022 颁发
-
World Finance Forex Awards 2022 颁发
-
World Finance Forex Awards 2022 颁发
-
交易社区平台FOLLOWME于2021年颁赠
-
2021年埃及Smart Vision Investment Expo博览会获颁赠
-
CFI.co于2021年颁赠
-
CFI.co于2021年颁赠
-
荣获Global Forex Awards 2021 — 零售外汇 颁赠
-
荣获Global Forex Awards 2021 — 零售外汇 颁赠
-
World Finance 2021颁发
-
World Finance 2021颁发
-
FOLLOWME于2021年颁赠
-
Global Forex Awards 2021 — B2B 颁赠
-
Global Forex Awards颁赠
-
Global Forex Awards颁赠
-
CFI.co于2020年颁赠
-
CFI.co于2020年颁赠
-
荣获Global Business Awards 2020
-
World Finance Magazine 颁赠
World Finance Forex Awards 2020 -
World Finance Magazine 颁赠
World Finance Forex Awards 2020 -
FOLLOWME交易社区授予
-
Global Forex Awards颁赠
-
Global Forex Awards颁赠
-
FinTech Age Awards颁发
-
World Finance Magazine 颁赠
World Finance Forex Awards 2019 -
World Finance Magazine 颁赠
World Finance Forex Awards 2019 -
荣获 World Finance Forex Awards 2018 颁赠
-
荣获2018年埃及金融博览会颁赠
-
荣获 Shares Magazine 的 UK Forex Awards 2017 颁赠
-
荣获 World Finance Forex Awards 2017
-
2016年最佳黄金经纪商
-
2016年最佳外汇经纪商
-
2015年最佳本地客户服务
-
Global Brands Magazine 颁赠
-
Online Money Awards 2022 颁发
-
荣获2022年埃及金融博览会颁赠
-
2015最佳外汇交易平台
-
2015最佳金融交易平台
-
2013最佳创新外汇平台奖
-
2020年 Cyprus HR Awards 颁赠
-
金融行业的佼佼者
-
认证最优金牌级别
-
2014年首届亚军

Awarded BestBrokerYear After Year
CATEGORIES
News
- 【XM Decision Analysis】--AUD/USD Forecast: Aussie Dollar Finds Support on Friday
- 【XM Decision Analysis】--USD/ILS Analysis: Slight Volatility and Return to Lower
- 【XM Forex】--ETH/USD Forecast: Ethereum Awaits Momentum
- 【XM Forex】--EUR/USD Analysis: Bearish Outlook Ahead of US Interest Rate Cut
- 【XM Group】--BTC/USD Forex Signal: Bullish Breakout to New Record High
market news
Gold fell below weekly support as scheduled, Europe and the United States paid attention to trend line resistance
Wonderful introduction:
A clean and honest man is the happiness of honest people, a prosperous business is the happiness of businessmen, a punishment of evil and traitors is the happiness of chivalrous men, a good character and academic performance is the happiness of students, aiding the poor and helping the poor is the happiness of good people, and planting in spring and harvesting in autumn is the happiness of farmers.
Hello everyone, today XM Foreign Exchange will bring you "[XM Foreign Exchange Market Review]: Gold fell below weekly support as scheduled, and Europe and the United States pay attention to trend line resistance." Hope it will be helpful to you! The original content is as follows:
Dollar Index
In terms of the performance of the US dollar index, the US dollar index showed a volatile trend on Tuesday. The price of the US dollar index rose to 97.816 on the day, and fell to 97.151 at the lowest point, and finally closed at 97.471. Looking back on Tuesday's market performance, during the early trading session, the price first corrected downward to test the four-hour support position, and then rose strongly again. At the same time, the price broke through the daily resistance position in the US session. Although it fell slightly overnight, the price still closed above the four-hour support and near the daily resistance. The daily price closed with a negative cross. For this cross, we need to pay attention to the continued rise of the oscillation, and follow up and focus on breaking through and standing firmly.
From a multi-cycle analysis, the price suppresses resistance in the 99 area at the weekly level, so from a medium-term perspective, the trend of the US dollar index will be more bearish. At the daily level, the key price resistance position is at 97.40 position over time. The current price is as the author said to test this area upward and perform a puncture. We need to pay attention to further actual breaking performance in the future. In the four-hour period, the recent price has been supported and risen after touching the channel line. It is currently rising. With the passage of time, it is currently supporting at 97.30. The price continues to be more treated above this position. Looking at the price fluctuating yesterday, the price needs to be paid attention to further fluctuations and then rise. Once the actual position is on the daily line, the resistance will continue to accelerate. From the trend line, the 97.20 area below is the lower edge of the short-term trend line rising, so the overall focus is on the 97.20-40 range to support the price increase, and the 97.80-98.10-98.30 area above.
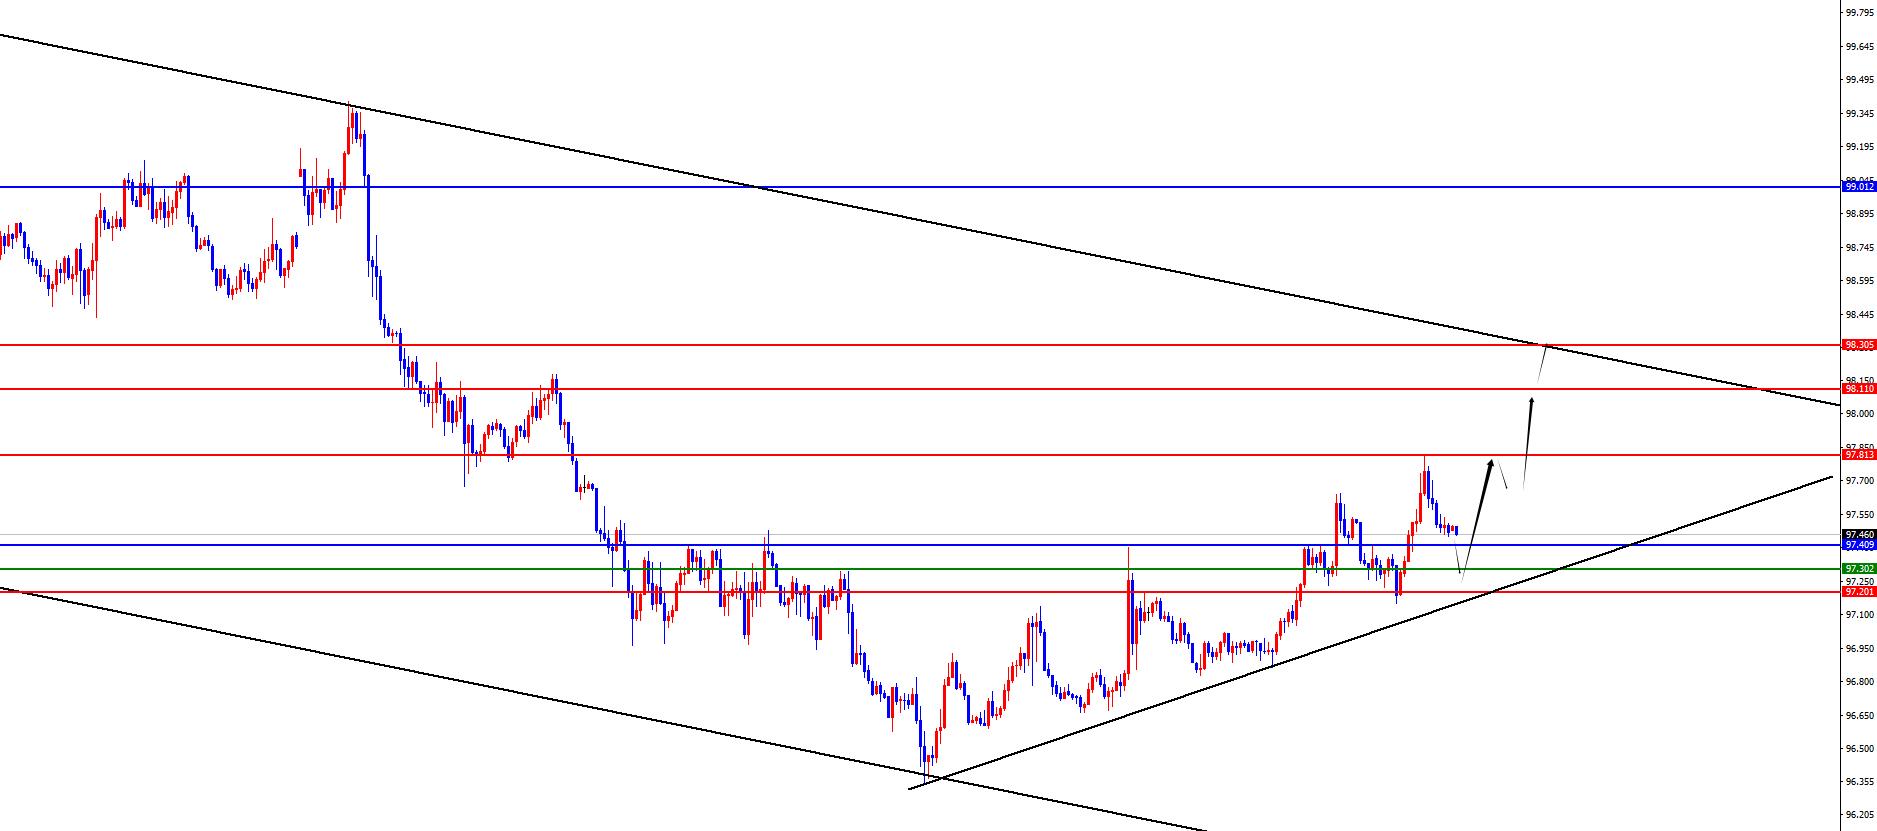
The US dollar index has a long range of 97.20-30, with a defense of 5 US dollars, and a target of 97.80-98.10-98.30
Gold
In terms of gold, the price of gold generally showed a decline on Monday, with the highest price rising to 3345.68 on the day, and the lowest fell to 3286.89 on the spot, closing at 3301.47 on the spot. Regarding Monday, gold first opened high in the early trading period, and the price did not continue, but was under pressure again, mainly because the price tested to the daily resistance position, and then remained weak during the day. The US also hit a low point again after the trading session. At the same time, the daily closing was below the weekly watershed position, so the overall focus will continue to pay attention to the pressure in the medium term of gold in the future.
From multi-cycle analysis, first observe the monthly rhythm. The price runs at the rhythm in May as the author said, and the final cross state. The final price in June is still in an anti-K state, so you still need to be cautious when dealing with the majority. From the weekly level, the price on the weekly line has continued to fluctuate at a high level recently. As time goes by, the weekly watershed is temporarily at the 3311 position. The price has now broken down, so the subsequent price can be treated as a medium-term decline below this position. According to the daily level, last week's price was under pressure as the author said, as further upward tests the daily resistance, and the current daily resistance is at 3328. The price is under pressure under the continuous band below this area. According to the four-hour level, the price fell below the four-hour support again yesterday, and the four-hour support once again became a key resistance. As time goes by, it is necessary to focus on the 3320 area, which is short-term short-term short-term. At the same time, according to the one-hour view, do not chase short for the time being. The rhythm is an oscillating decline, so wait until the price falls back to the four-hour and daily resistance areas before looking at the pressure. Pay attention to the 3275-3250 area below.
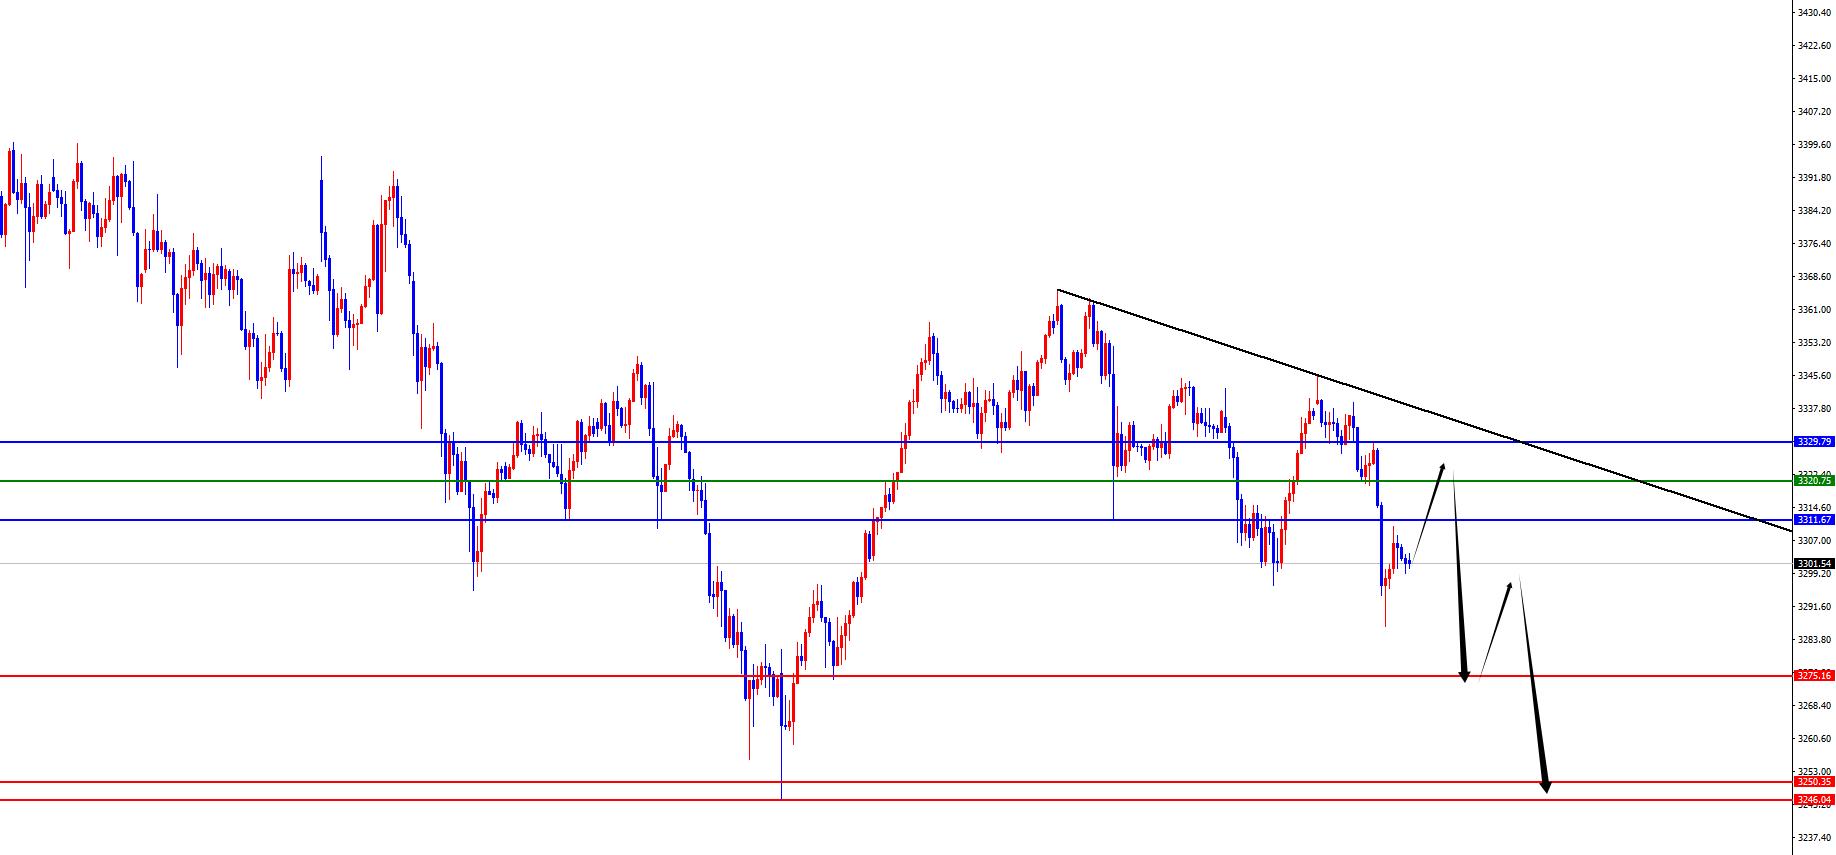
Gold increased its position in short positions in the 3320-25 range, defended 10 US dollars, and targeted 3275-3250
Europe and the United States
Europe and the United States, prices in Europe and the United States were generally on Tuesday. The price fell to 1.1682 on the day, and rose to 1.1765 on the highest, closing at 1.1724 on the market. Looking back at the performance of European and American markets on Tuesday, during the early trading session, the price first corrected upward and tested to near the four-hour resistance and then was under pressure again. The price tested downward and stopped after the daily support. Finally, the big sun ended on that day. For the subsequent needs to pay attention to the gains and losses of the daily watershed position.
From a multi-cycle analysis, from the perspective of the monthly line level, Europe and the United States are supported at 1.0950, so long-term bulls are treated, and the monthly line ends with a big positive, so long-term bullishness is still relatively large. From the weekly level, the price is supported by the 1.1450 area, and continues to look bullish from the perspective of the midline. The price decline is temporarily used as the midline.Revised treatment in the rise. From the daily level, as time goes by, we need to focus on the watershed between 1.1700 and yesterday's low point range. The bands above this position are treated more frequently, but it is important to pay attention to whether they can break further after subsequent oscillations. From the four-hour level, we need to pay attention to the 1.1730 position and the upper trend line 1.1760-70 range resistance. From the one-hour level, considering that the current price test has rebounded after the daily support, it is important to pay attention to the trend line resistance suppression in the future, and to pay attention to whether it can further break the daily support.
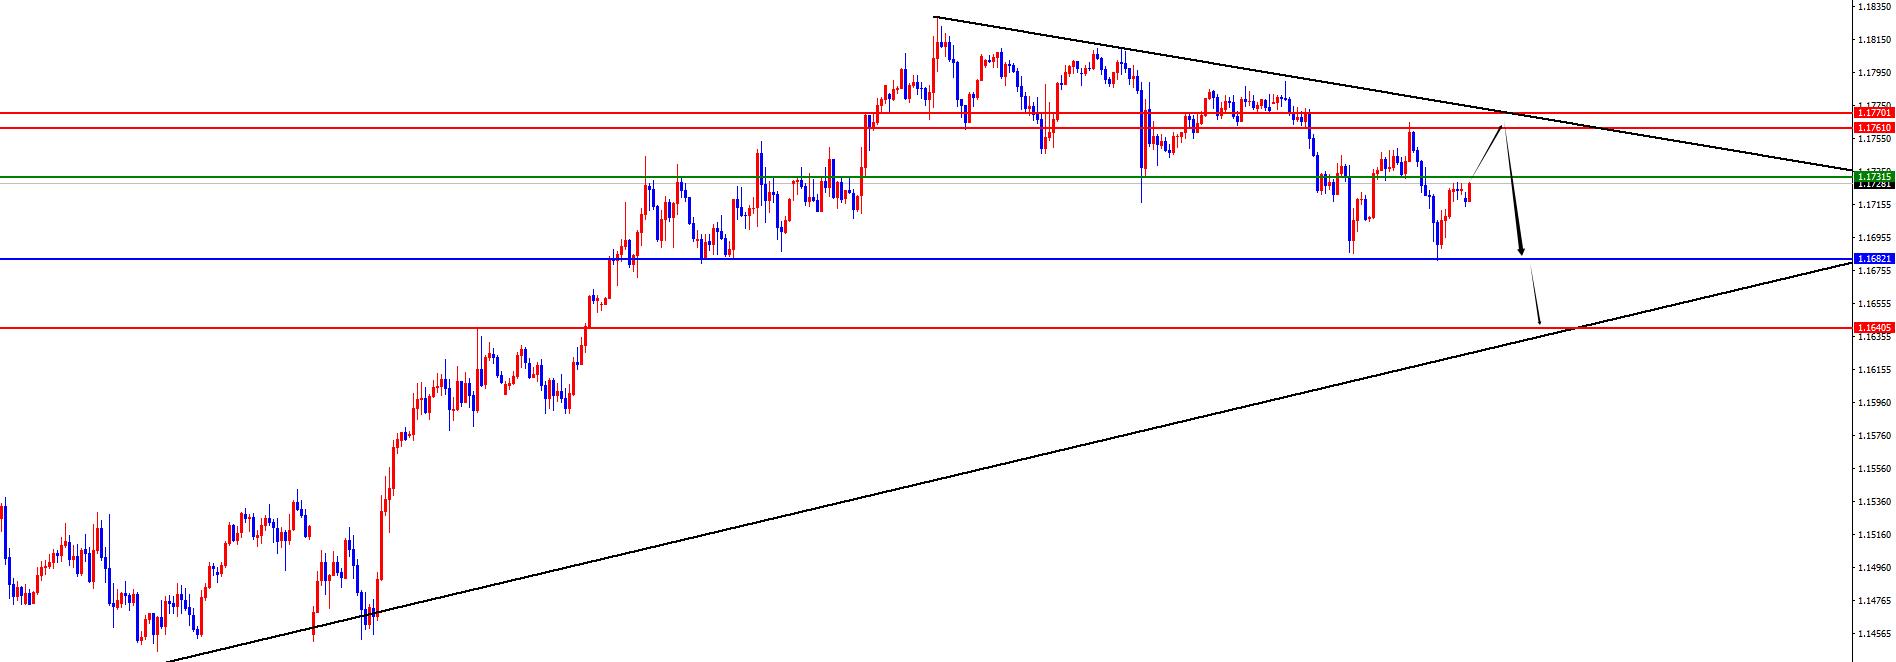
Europe and the United States have a short range of 1.1760-70, defense is 40 points, target 1.0700-1.0640
[Finance data and events that are focused today] Wednesday, July 8, 2025
①09:30 China's June CPI annual rate
②10:00 New Zealand Fed announced interest rate resolution
③11:00 New Zealand Fed Chairman Orr held a press conference
④22:00 United States May wholesale sales monthly rate
⑤22:30 United States to July 4 EIA crude oil inventories
⑥ 22:30 EIA Cushing crude oil inventories in the week from the United States to July 4
⑦22:30 EIA strategic oil reserve inventories in the week from the United States to July 4
⑧ Next day 01:00 US to July 9 10-year Treasury bond auction-winning interest rate
⑨ Next day 01:00 US to July 9 10-year Treasury bond auction-tender multiple
⑩ Next day 02:00 US to July 9
The Federal Reserve announced the minutes of the monetary policy meeting
Note: The above is only personal opinions and strategies, for review and exchange only, and does not give customers any investment advice. It has nothing to do with customers' investment, and is not used as a basis for placing an order.
The above content is all about "[XM Foreign Exchange Market Review]: Gold fell below weekly support as scheduled, Europe and the United States paid attention to trend line resistance". It was carefully www.xmhouses.compiled and edited by the editor of XM Foreign Exchange. I hope it will be helpful to your trading! Thanks for the support!
Share, just as simple as a gust of wind can bring refreshment, just as pure as a flower can bring fragrance. The dusty heart gradually opened, and I learned to share, sharing is actually so simple.
Disclaimers: XM Group only provides execution services and access permissions for online trading platforms, and allows individuals to view and/or use the website or the content provided on the website, but has no intention of making any changes or extensions, nor will it change or extend its services and access permissions. All access and usage permissions will be subject to the following terms and conditions: (i) Terms and conditions; (ii) Risk warning; And (iii) a complete disclaimer. Please note that all information provided on the website is for general informational purposes only. In addition, the content of all XM online trading platforms does not constitute, and cannot be used for any unauthorized financial market trading invitations and/or invitations. Financial market transactions pose significant risks to your investment capital.
All materials published on online trading platforms are only intended for educational/informational purposes and do not include or should be considered for financial, investment tax, or trading related consulting and advice, or transaction price records, or any financial product or non invitation related trading offers or invitations.
All content provided by XM and third-party suppliers on this website, including opinions, news, research, analysis, prices, other information, and third-party website links, remains unchanged and is provided as general market commentary rather than investment advice. All materials published on online trading platforms are only for educational/informational purposes and do not include or should be considered as applicable to financial, investment tax, or trading related advice and recommendations, or transaction price records, or any financial product or non invitation related financial offers or invitations. Please ensure that you have read and fully understood the information on XM's non independent investment research tips and risk warnings. For more details, please click here