


Trusted by over 15 Million Traders
The Most Awarded Broker
for a Reason
Easy Access to 1,400+ Global Assets
EURUSD
Euro vs U.S. Dollar
US500
S&P 500 (US500)
GOLD
Gold
COFFEE
US Coffee
Apple
Apple (AAPL.OQ)
-

Finance Magnates 颁发
-

Finance Magnates 颁发
-

Capital Finance International Magazine (CFI.co) 2024年颁赠
-

COLWMA 2024年颁赠
-

荣获World Finance Forex Awards 2023最佳外汇客户服务奖
-

荣获World Finance Forex Awards 2023欧洲最佳外汇经纪商奖
-

荣获World Finance Forex Awards 2023澳大拉西亚最佳外汇经纪商奖
-

荣获World Finance Forex Awards 2023拉丁美洲最佳外汇经纪商奖
-

荣获World Finance Forex Awards 2023中东最佳外汇经纪商奖
-

CFI.co于2023年颁赠
-

荣获2023年City of London Wealth Management Awards
-

荣获2022年埃及金融博览会颁赠
-

荣获2022年City of London Wealth Management Awards
-

CFI.co于2022年颁赠
-

荣获Global Forex Awards 2022 — 零售外汇 颁赠
-
2021年迪拜外汇博览会获颁赠
-

Ultimate Fintech 2021年颁赠
-

荣获2021年City of London Wealth Management Awards
-

FX168于2020年12月颁赠
-

荣获Global Business Awards 2020
-

荣获2020年City of London Wealth Management Awards
-

Capital Finance International Magazine (CFI.co)颁赠
-

Capital Finance International Magazine (CFI.co)颁赠
-

荣获2019年City of London Wealth Management Awards
-

Shares Magazine 授予 UK Forex Awards 2018
-

Capital Finance International Magazine (CFI.co)颁赠
-

Capital Finance International Magazine (CFI.co)颁赠
-

2017年伦敦财富管理奖
-

2016最佳本土 客户服务
-

中东和北非地区(MENA)增长最快的经纪商
-
2015年最佳外汇科技提供商
-
2014年最佳外汇科技提供商
-

2014年最佳外汇科技提供商
-

荣获 The Trading Show 2024年非洲 Africa Fintech 峰会颁赠
-

荣获2024年中东地区 Brokersview 颁赠
-
荣获2024年中东地区 Brokersview 颁赠
-

荣获2024年阿曼 Smart Vision 峰会颁赠
-

荣获2024年迪拜外汇博览会颁赠
-

荣获2024年迪拜 Forex Traders Summit 颁赠
-

2024年埃及 Smart Vision 峰会颁赠
-

投查查于2024年颁赠
-

Capital Finance International Magazine (CFI.co) 2024年颁赠
-

CFI.co于2023年颁赠
-

CFI.co于2023年颁赠
-

交易社区平台FOLLOWME于2022年颁赠
-
2022年迪拜Forex Expo获颁赠
-
2022年迪拜Forex Expo获颁赠
-

荣获Global Forex Awards 2022 — 零售外汇 颁赠
-

CFI.co于2022年颁赠
-

CFI.co于2022年颁赠
-

World Finance Forex Awards 2022 颁发
-

World Finance Forex Awards 2022 颁发
-

World Finance Forex Awards 2022 颁发
-

World Finance Forex Awards 2022 颁发
-
交易社区平台FOLLOWME于2021年颁赠
-

2021年埃及Smart Vision Investment Expo博览会获颁赠
-

CFI.co于2021年颁赠
-

CFI.co于2021年颁赠
-

荣获Global Forex Awards 2021 — 零售外汇 颁赠
-

荣获Global Forex Awards 2021 — 零售外汇 颁赠
-

World Finance 2021颁发
-

World Finance 2021颁发
-
FOLLOWME于2021年颁赠
-

Global Forex Awards 2021 — B2B 颁赠
-

Global Forex Awards颁赠
-

Global Forex Awards颁赠
-

CFI.co于2020年颁赠
-

CFI.co于2020年颁赠
-

荣获Global Business Awards 2020
-

World Finance Magazine 颁赠
World Finance Forex Awards 2020 -

World Finance Magazine 颁赠
World Finance Forex Awards 2020 -
FOLLOWME交易社区授予
-

Global Forex Awards颁赠
-

Global Forex Awards颁赠
-

FinTech Age Awards颁发
-

World Finance Magazine 颁赠
World Finance Forex Awards 2019 -

World Finance Magazine 颁赠
World Finance Forex Awards 2019 -

荣获 World Finance Forex Awards 2018 颁赠
-

荣获2018年埃及金融博览会颁赠
-

荣获 Shares Magazine 的 UK Forex Awards 2017 颁赠
-

荣获 World Finance Forex Awards 2017
-

2016年最佳黄金经纪商
-

2016年最佳外汇经纪商
-

2015年最佳本地客户服务
-

Global Brands Magazine 颁赠
-

Online Money Awards 2022 颁发
-

荣获2022年埃及金融博览会颁赠
-

2015最佳外汇交易平台
-

2015最佳金融交易平台
-

2013最佳创新外汇平台奖
-

2020年 Cyprus HR Awards 颁赠
-

金融行业的佼佼者
-

认证最优金牌级别
-

2014年首届亚军
-
Finance Magnates 颁发
-
Finance Magnates 颁发
-
Capital Finance International Magazine (CFI.co) 2024年颁赠
-
COLWMA 2024年颁赠
-
荣获World Finance Forex Awards 2023最佳外汇客户服务奖
-
荣获World Finance Forex Awards 2023欧洲最佳外汇经纪商奖
-
荣获World Finance Forex Awards 2023澳大拉西亚最佳外汇经纪商奖
-
荣获World Finance Forex Awards 2023拉丁美洲最佳外汇经纪商奖
-
荣获World Finance Forex Awards 2023中东最佳外汇经纪商奖
-
CFI.co于2023年颁赠
-
荣获2023年City of London Wealth Management Awards
-
荣获2022年埃及金融博览会颁赠
-
荣获2022年City of London Wealth Management Awards
-
CFI.co于2022年颁赠
-
荣获Global Forex Awards 2022 — 零售外汇 颁赠
-
2021年迪拜外汇博览会获颁赠
-
Ultimate Fintech 2021年颁赠
-
荣获2021年City of London Wealth Management Awards
-
FX168于2020年12月颁赠
-
荣获Global Business Awards 2020
-
荣获2020年City of London Wealth Management Awards
-
Capital Finance International Magazine (CFI.co)颁赠
-
Capital Finance International Magazine (CFI.co)颁赠
-
荣获2019年City of London Wealth Management Awards
-
Shares Magazine 授予 UK Forex Awards 2018
-
Capital Finance International Magazine (CFI.co)颁赠
-
Capital Finance International Magazine (CFI.co)颁赠
-
2017年伦敦财富管理奖
-
2016最佳本土 客户服务
-
中东和北非地区(MENA)增长最快的经纪商
-
2015年最佳外汇科技提供商
-
2014年最佳外汇科技提供商
-
2014年最佳外汇科技提供商
-
荣获 The Trading Show 2024年非洲 Africa Fintech 峰会颁赠
-
荣获2024年中东地区 Brokersview 颁赠
-
荣获2024年中东地区 Brokersview 颁赠
-
荣获2024年阿曼 Smart Vision 峰会颁赠
-
荣获2024年迪拜外汇博览会颁赠
-
荣获2024年迪拜 Forex Traders Summit 颁赠
-
2024年埃及 Smart Vision 峰会颁赠
-
投查查于2024年颁赠
-
Capital Finance International Magazine (CFI.co) 2024年颁赠
-
CFI.co于2023年颁赠
-
CFI.co于2023年颁赠
-
交易社区平台FOLLOWME于2022年颁赠
-
2022年迪拜Forex Expo获颁赠
-
2022年迪拜Forex Expo获颁赠
-
荣获Global Forex Awards 2022 — 零售外汇 颁赠
-
CFI.co于2022年颁赠
-
CFI.co于2022年颁赠
-
World Finance Forex Awards 2022 颁发
-
World Finance Forex Awards 2022 颁发
-
World Finance Forex Awards 2022 颁发
-
World Finance Forex Awards 2022 颁发
-
交易社区平台FOLLOWME于2021年颁赠
-
2021年埃及Smart Vision Investment Expo博览会获颁赠
-
CFI.co于2021年颁赠
-
CFI.co于2021年颁赠
-
荣获Global Forex Awards 2021 — 零售外汇 颁赠
-
荣获Global Forex Awards 2021 — 零售外汇 颁赠
-
World Finance 2021颁发
-
World Finance 2021颁发
-
FOLLOWME于2021年颁赠
-
Global Forex Awards 2021 — B2B 颁赠
-
Global Forex Awards颁赠
-
Global Forex Awards颁赠
-
CFI.co于2020年颁赠
-
CFI.co于2020年颁赠
-
荣获Global Business Awards 2020
-
World Finance Magazine 颁赠
World Finance Forex Awards 2020 -
World Finance Magazine 颁赠
World Finance Forex Awards 2020 -
FOLLOWME交易社区授予
-
Global Forex Awards颁赠
-
Global Forex Awards颁赠
-
FinTech Age Awards颁发
-
World Finance Magazine 颁赠
World Finance Forex Awards 2019 -
World Finance Magazine 颁赠
World Finance Forex Awards 2019 -
荣获 World Finance Forex Awards 2018 颁赠
-
荣获2018年埃及金融博览会颁赠
-
荣获 Shares Magazine 的 UK Forex Awards 2017 颁赠
-
荣获 World Finance Forex Awards 2017
-
2016年最佳黄金经纪商
-
2016年最佳外汇经纪商
-
2015年最佳本地客户服务
-
Global Brands Magazine 颁赠
-
Online Money Awards 2022 颁发
-
荣获2022年埃及金融博览会颁赠
-
2015最佳外汇交易平台
-
2015最佳金融交易平台
-
2013最佳创新外汇平台奖
-
2020年 Cyprus HR Awards 颁赠
-
金融行业的佼佼者
-
认证最优金牌级别
-
2014年首届亚军

Awarded BestBrokerYear After Year
CATEGORIES
News
- 【XM Group】--Dax Forecast: Continues to Build Pressures
- 【XM Forex】--USD/MXN Forecast: Nears Key 21 Resistance
- 【XM Decision Analysis】--USD/JPY Forecast: US Dollar Pulls Back Against Japanese
- 【XM Decision Analysis】--Pairs in Focus - EUR/USD, USD/JPY, CAD/JPY, EUR/GBP, BTC
- 【XM Forex】--GBP/USD Forecast: Looking for Higher Levels
market news
The daily gold line 618 fell under pressure as scheduled, while Europe and the United States remained unchanged
Wonderful introduction:
Optimism is the line of egrets that are straight up to the blue sky, optimism is the ten thousand white sails beside the sunken boat, optimism is the lush grass that blows with the wind on the head of the parrot island, optimism is the falling red spots that turn into spring mud to protect the flowers.
Hello everyone, today XM Foreign Exchange will bring you "[XM Foreign Exchange Market Analysis]: The daily gold line 618 is under pressure and decline as scheduled, while the European and American fluctuations and declines remain unchanged." Hope it will be helpful to you! The original content is as follows:
Dollar Index
In terms of the performance of the US dollar index, the US dollar index showed an upward trend on Monday. The price of the US dollar index rose to 98.112 on the day, and fell to 97.737 at the lowest, and finally closed at 98.088. Looking back at the market performance on Monday, the price first opened high during the early trading session, and then adjusted slightly again to test the four-hour support and stopped rising around the rise, showing a volatile rise overall. In the end, the price ended with a big positive end, and the US dollar index continued to see the bulls continue in the future.
From a multi-cycle analysis, the price is suppressed in the 98.90 area of resistance, so from a medium-term perspective, the trend of the US dollar index will be more bearish. At the daily level, the key price support position is at 97.30 as time goes by. The price has actually broken through and stood firm. In the future, the band above this will be treated more frequently. In the four-hour period, the recent price has been supported and risen after touching the channel line. It is currently rising. With the passage of time, it is currently supporting at 97.90. The price continues to be more treated above this position. Looking at the one-hour front, the short-term price is currently downward. First, pay attention to the four-hour support in the short term. The overall price will remain unchanged above the daily and four-hour support. We will pay attention to the test weekly resistance area in the future.
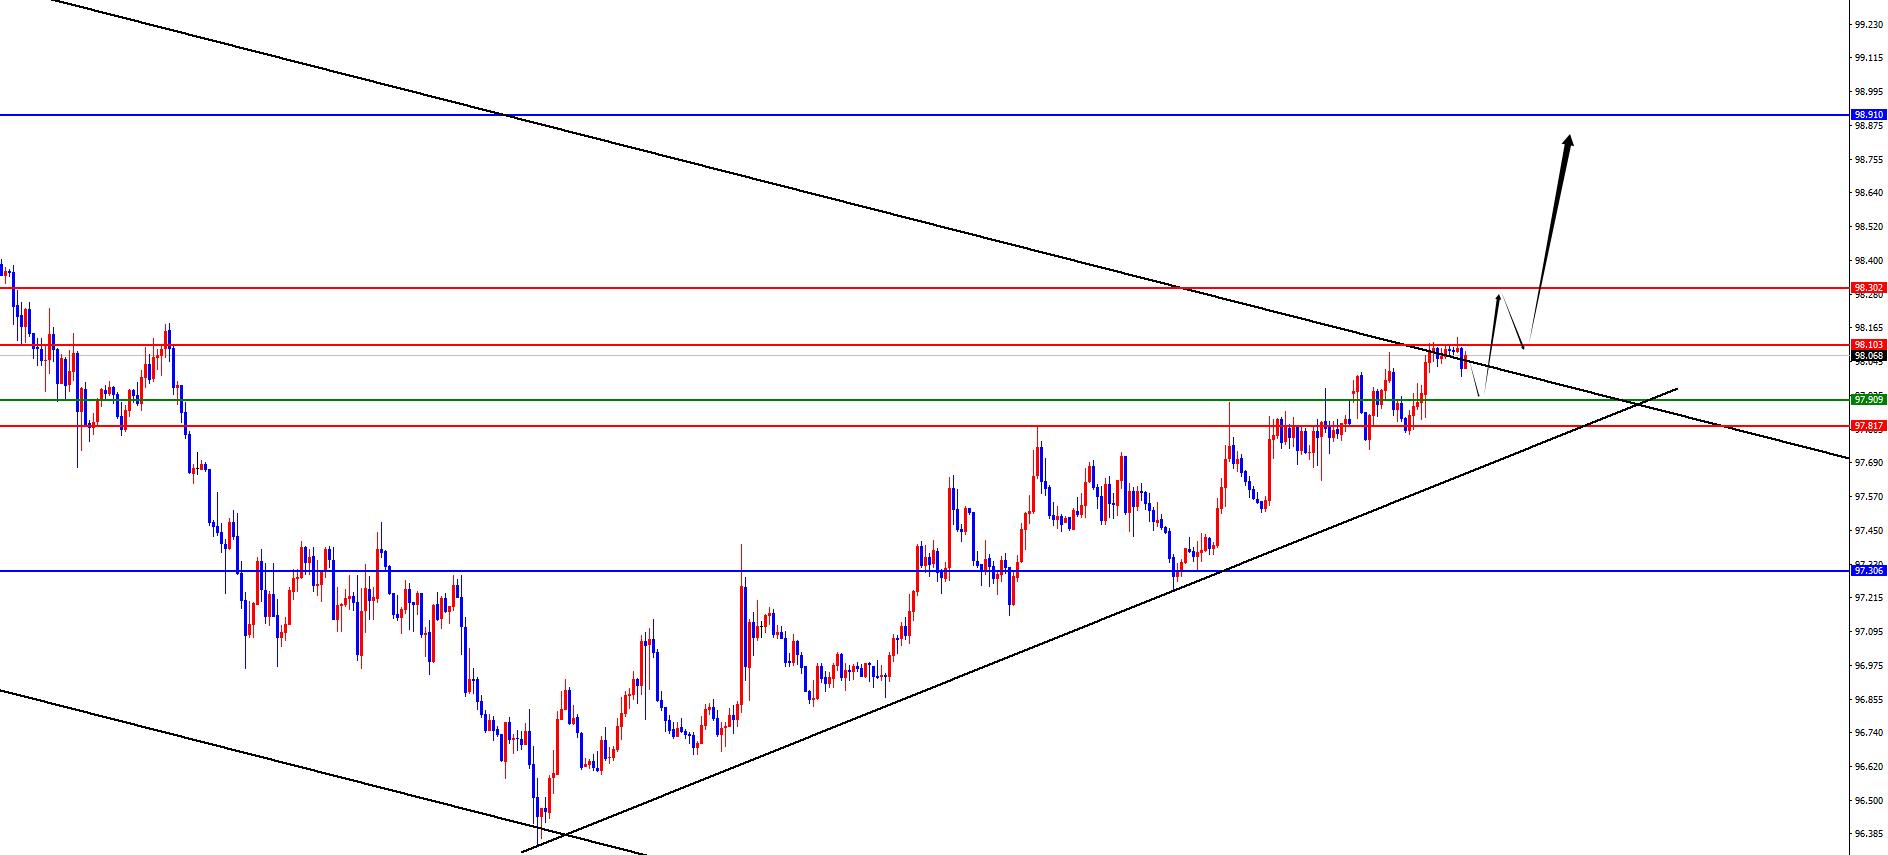
The US dollar index has a long range of 97.80-90, with a defense of 5 US dollars and a target of 98.30-98.90
Gold
In terms of gold, the overall gold price on Monday showed a downward trend, with the highest price rising to 3 on the day.The 374.85 position fell to 3340.89 position and closed at 3343.19 position. Regarding the price of gold opened higher during the morning session on Monday, and then reached the 618 position of the daily decline and retreated. Then, as the author said, it fell further and stopped after testing it to the four-hour support position. The price ended on the same day with a big negative price. In the short term, you need to pay attention to the gains and losses of the four-hour support.
From multi-cycle analysis, first observe the monthly rhythm. The price runs at the rhythm in May as the author said, and the final cross state. The final price in June is still in an anti-K state, so you still need to be cautious when dealing with the majority. From the weekly level, prices on the weekly line have continued to fluctuate at high levels recently. As time goes by, the weekly watershed is temporarily at 3320-3322. The subsequent weekly closing of the weekly price will be further under pressure at this position, otherwise it will still fluctuate at a high level. According to the daily level, the price broke through the daily resistance position last Friday, so the band is currently in a relatively long position. Yesterday, the price stopped falling at the 618 position of the decline and retracement as expected, and finally the daily line ended in a big negative position. In the future, we need to pay attention to the gains and losses of the 3328 band watershed. According to the four-hour level, the price stabilized in the four-hour resistance position last Thursday and is currently running above the four-hour support. Four hours is the key to the short-term trend. From the perspective of position, the key support for the four-hour time is at the 3340 position. The price is relatively long above this position. The price will continue in the short term after the price breaks down. After the price fell smoothly yesterday, there are signs of short-term adjustments, so I will not chase it for the time being, but the above focus on the resistance of 3358 regionally. It is key to pay attention to whether the price can be further under pressure after it is in place.
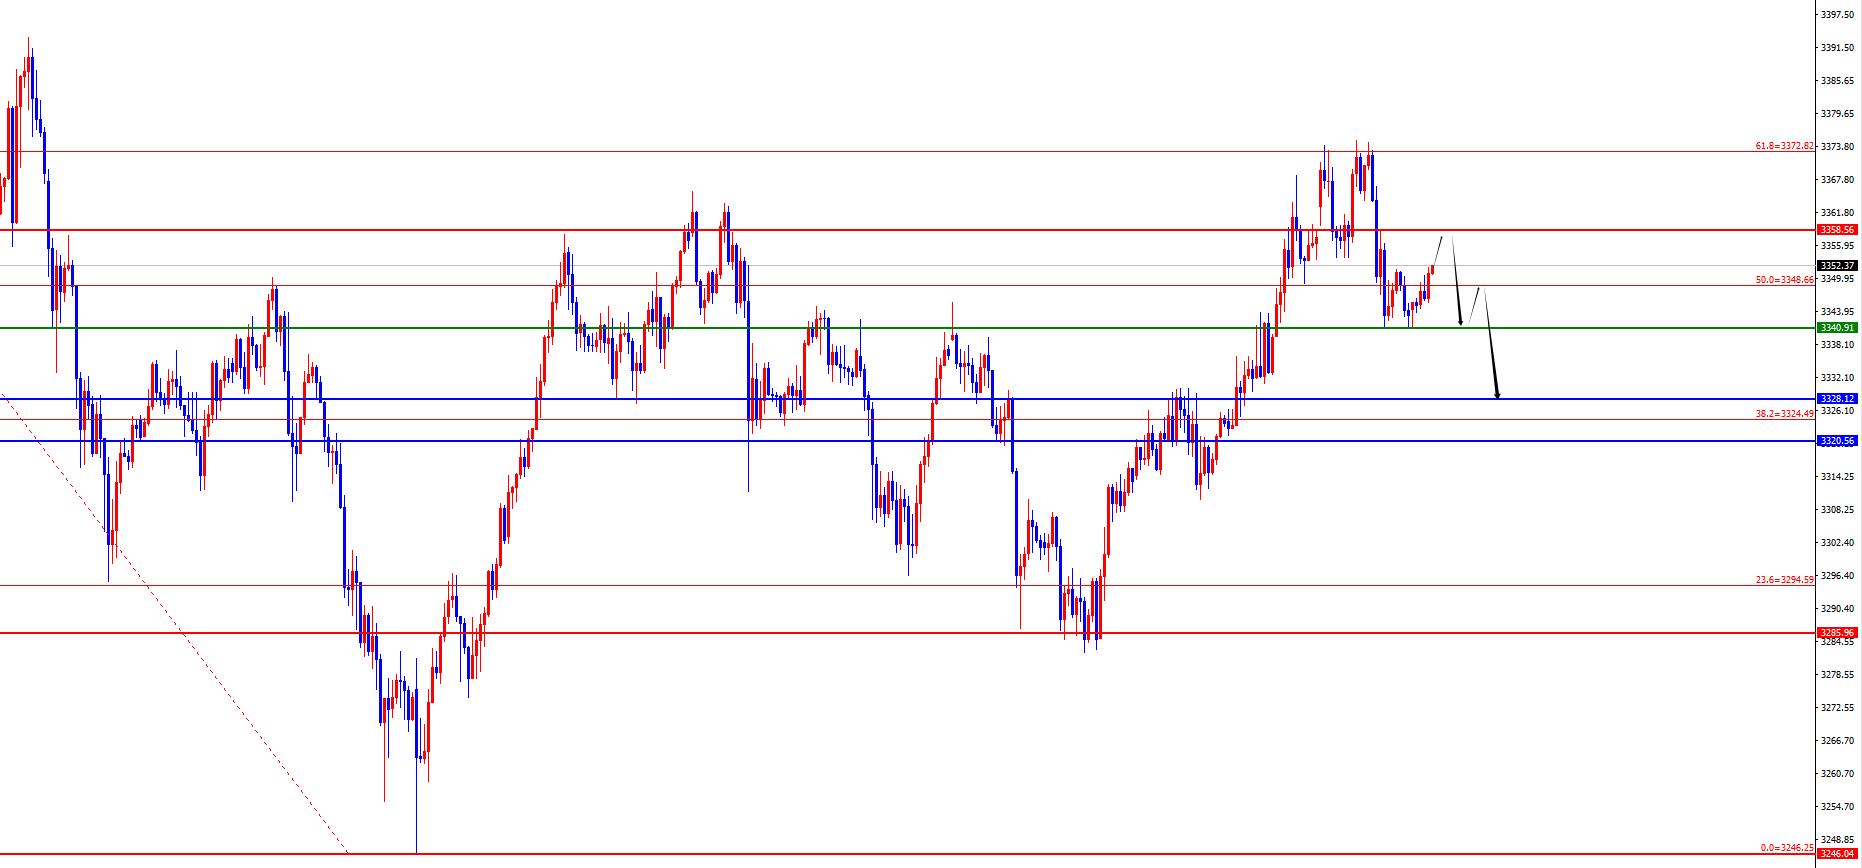
Gold 3358-3359 is empty in the area, with a defense of US$10, and a target of 3350-3340-3328-3320
European and the United States
European and the United States were generally fluctuating on Monday. The price fell to 1.1653 at the lowest point on the day, and rose to 1.1697 at the highest point and closed at 1.1663 at the same time. Looking back at the performance of European and American markets on Monday, the price first opened low in the short term during the early trading session, and then the price continued to suppress the fluctuation and decline below the four-hour resistance. From the final closing, the price ended with a small positive price. This performance also shows that the price is not extremely weak, so it needs to be treated in a fluctuating and falling way for the time being.
From a multi-cycle analysis, from the perspective of the monthly line level, Europe and the United States are supported at 1.0950, so long-term bulls are treated, and the monthly line ends with a big positive, so long-term bullishness is still relatively large. From the weekly level, the price is supported by the 1.1460 area, and continues to be bullish from the perspective of the mid-line. The price decline is temporarily treated as a correction in the mid-line rise. From the daily level, as time goes by, we need to focus on the 1.1730 position. The price will be further broken down as the author said, and the band below this position will be treated shortly. fromAt the four-hour level, we need to pay attention to the 1.1690 regional resistance. The price is short-term short-term short-term, but we are wary of the price being adjusted slightly again in the four hours. At the same time, according to the one-hour level, the price is currently fluctuating and falling in the short term, and the short-term market shows signs of adjustment, so wait for the price to rebound upward and correct before looking at further pressure. At the position, we pay attention to the four-hour resistance and daily resistance under pressure.
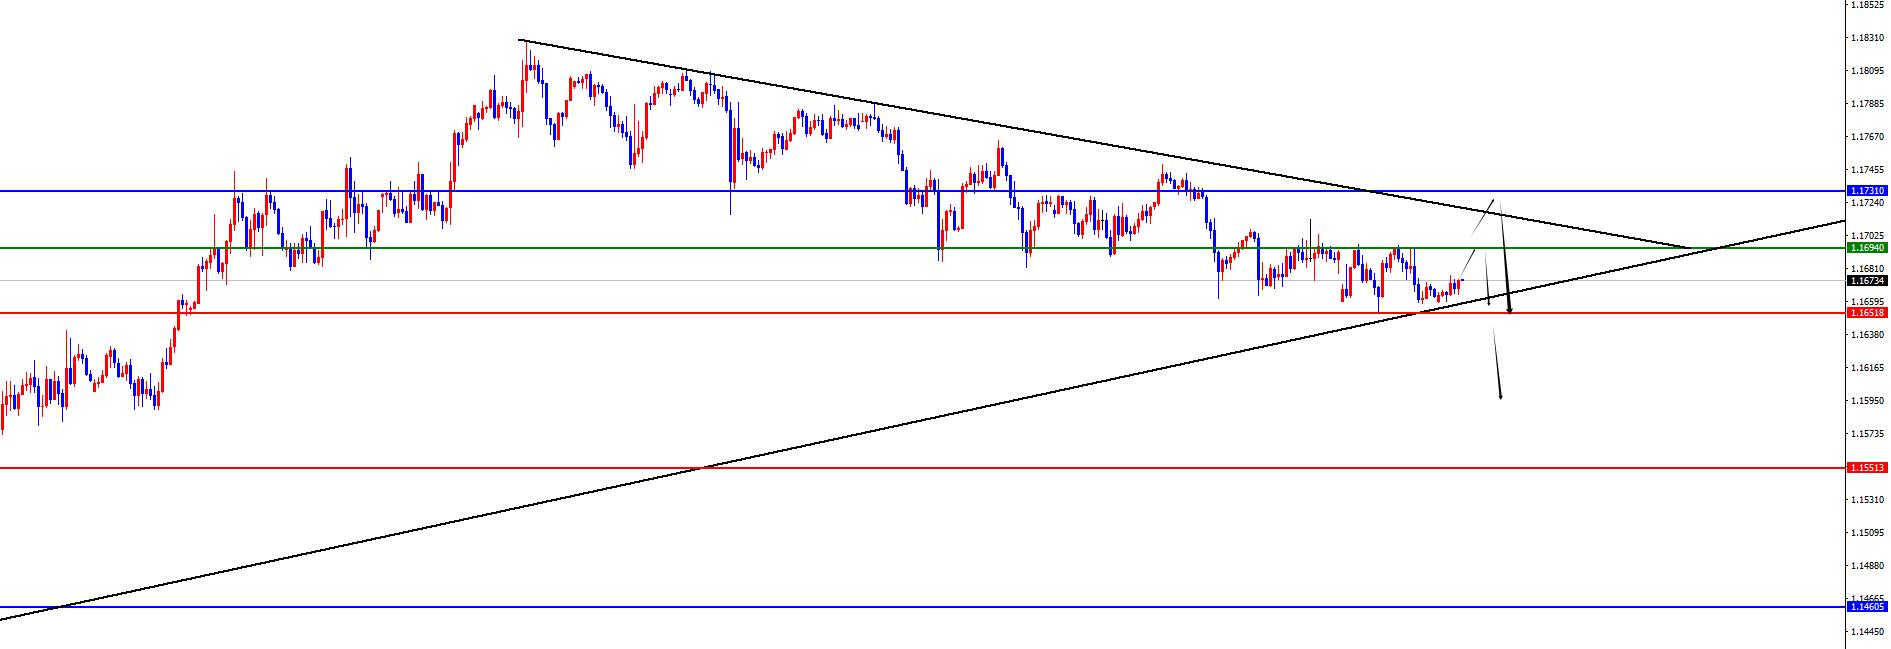
Europe and the United States have a short range of 1.1720-30, defense is 50 points, target 1.1690-1.1630
[Finance data and events that are focused today] Tuesday, July 15, 2025
①To be determined domestic refined oil has opened a new round of price adjustment window
②To be determined OPEC released its monthly crude oil market report
③To be determined the governor and finance minister of the Bank of England delivered speeches
④0 9:30 Monthly report on residential prices in 70 large and medium-sized cities in China
⑤10:00 China's second quarter GDP annual rate
⑥10:00 China's total retail sales of consumer goods in June year-on-year
⑦10:00 China's industrial added value above scale in June year-on-year
⑧14:45 Federal Reserve Collins delivered a speech
⑨17:00 Germany's July ZEW Economic Prosperity Index
⑩17: 00 Eurozone July ZEW Economic Prosperity Index
17:00 Eurozone May Industrial Output Monthly Rate
20:30 Canada June CPI Monthly Rate
20:30 US June Unseasonal CPI Annual Rate
20:30 US June Seasonal CPI Monthly Rate
20:30 US June Seasonal CPI Monthly Rate
20:30 US June Seasonal Core CPI Monthly Rate
20:30 US June Unseasonal Core CPI Annual rate
20:30 US New York Fed Manufacturing Index in July
21:15 Federal Reserve Director Bauman delivered a speech at the meeting
00:45 Federal Reserve Director Barr delivered a speech
02:45 Federal Reserve Collins delivered a speech
Note: The above is only personal opinions and strategies, for reference and www.xmhouses.communication only, and does not give customers any investment advice. It has nothing to do with customers' investment, and is not used as a basis for placing an order.
The above content is all about "[XM Foreign Exchange Market Analysis]: The daily gold line 618 is under pressure and falling as scheduled, while the European and American fluctuations and declines remain unchanged". It is carefully www.xmhouses.compiled and edited by the editor of XM Foreign Exchange. I hope it will be helpful to your trading! Thanks for the support!
Spring, summer, autumn and winter, every season is a beautiful scenery, and it stays in my heart forever. Leave~~~
Disclaimers: XM Group only provides execution services and access permissions for online trading platforms, and allows individuals to view and/or use the website or the content provided on the website, but has no intention of making any changes or extensions, nor will it change or extend its services and access permissions. All access and usage permissions will be subject to the following terms and conditions: (i) Terms and conditions; (ii) Risk warning; And (iii) a complete disclaimer. Please note that all information provided on the website is for general informational purposes only. In addition, the content of all XM online trading platforms does not constitute, and cannot be used for any unauthorized financial market trading invitations and/or invitations. Financial market transactions pose significant risks to your investment capital.
All materials published on online trading platforms are only intended for educational/informational purposes and do not include or should be considered for financial, investment tax, or trading related consulting and advice, or transaction price records, or any financial product or non invitation related trading offers or invitations.
All content provided by XM and third-party suppliers on this website, including opinions, news, research, analysis, prices, other information, and third-party website links, remains unchanged and is provided as general market commentary rather than investment advice. All materials published on online trading platforms are only for educational/informational purposes and do not include or should be considered as applicable to financial, investment tax, or trading related advice and recommendations, or transaction price records, or any financial product or non invitation related financial offers or invitations. Please ensure that you have read and fully understood the information on XM's non independent investment research tips and risk warnings. For more details, please click here