


Trusted by over 15 Million Traders
The Most Awarded Broker
for a Reason
Easy Access to 1,400+ Global Assets
EURUSD
Euro vs U.S. Dollar
US500
S&P 500 (US500)
GOLD
Gold
COFFEE
US Coffee
Apple
Apple (AAPL.OQ)
-

Finance Magnates 颁发
-

Finance Magnates 颁发
-

Capital Finance International Magazine (CFI.co) 2024年颁赠
-

COLWMA 2024年颁赠
-

荣获World Finance Forex Awards 2023最佳外汇客户服务奖
-

荣获World Finance Forex Awards 2023欧洲最佳外汇经纪商奖
-

荣获World Finance Forex Awards 2023澳大拉西亚最佳外汇经纪商奖
-

荣获World Finance Forex Awards 2023拉丁美洲最佳外汇经纪商奖
-

荣获World Finance Forex Awards 2023中东最佳外汇经纪商奖
-

CFI.co于2023年颁赠
-

荣获2023年City of London Wealth Management Awards
-

荣获2022年埃及金融博览会颁赠
-

荣获2022年City of London Wealth Management Awards
-

CFI.co于2022年颁赠
-

荣获Global Forex Awards 2022 — 零售外汇 颁赠
-
2021年迪拜外汇博览会获颁赠
-

Ultimate Fintech 2021年颁赠
-

荣获2021年City of London Wealth Management Awards
-

FX168于2020年12月颁赠
-

荣获Global Business Awards 2020
-

荣获2020年City of London Wealth Management Awards
-

Capital Finance International Magazine (CFI.co)颁赠
-

Capital Finance International Magazine (CFI.co)颁赠
-

荣获2019年City of London Wealth Management Awards
-

Shares Magazine 授予 UK Forex Awards 2018
-

Capital Finance International Magazine (CFI.co)颁赠
-

Capital Finance International Magazine (CFI.co)颁赠
-

2017年伦敦财富管理奖
-

2016最佳本土 客户服务
-

中东和北非地区(MENA)增长最快的经纪商
-
2015年最佳外汇科技提供商
-
2014年最佳外汇科技提供商
-

2014年最佳外汇科技提供商
-

荣获 The Trading Show 2024年非洲 Africa Fintech 峰会颁赠
-

荣获2024年中东地区 Brokersview 颁赠
-
荣获2024年中东地区 Brokersview 颁赠
-

荣获2024年阿曼 Smart Vision 峰会颁赠
-

荣获2024年迪拜外汇博览会颁赠
-

荣获2024年迪拜 Forex Traders Summit 颁赠
-

2024年埃及 Smart Vision 峰会颁赠
-

投查查于2024年颁赠
-

Capital Finance International Magazine (CFI.co) 2024年颁赠
-

CFI.co于2023年颁赠
-

CFI.co于2023年颁赠
-

交易社区平台FOLLOWME于2022年颁赠
-
2022年迪拜Forex Expo获颁赠
-
2022年迪拜Forex Expo获颁赠
-

荣获Global Forex Awards 2022 — 零售外汇 颁赠
-

CFI.co于2022年颁赠
-

CFI.co于2022年颁赠
-

World Finance Forex Awards 2022 颁发
-

World Finance Forex Awards 2022 颁发
-

World Finance Forex Awards 2022 颁发
-

World Finance Forex Awards 2022 颁发
-
交易社区平台FOLLOWME于2021年颁赠
-

2021年埃及Smart Vision Investment Expo博览会获颁赠
-

CFI.co于2021年颁赠
-

CFI.co于2021年颁赠
-

荣获Global Forex Awards 2021 — 零售外汇 颁赠
-

荣获Global Forex Awards 2021 — 零售外汇 颁赠
-

World Finance 2021颁发
-

World Finance 2021颁发
-
FOLLOWME于2021年颁赠
-

Global Forex Awards 2021 — B2B 颁赠
-

Global Forex Awards颁赠
-

Global Forex Awards颁赠
-

CFI.co于2020年颁赠
-

CFI.co于2020年颁赠
-

荣获Global Business Awards 2020
-

World Finance Magazine 颁赠
World Finance Forex Awards 2020 -

World Finance Magazine 颁赠
World Finance Forex Awards 2020 -
FOLLOWME交易社区授予
-

Global Forex Awards颁赠
-

Global Forex Awards颁赠
-

FinTech Age Awards颁发
-

World Finance Magazine 颁赠
World Finance Forex Awards 2019 -

World Finance Magazine 颁赠
World Finance Forex Awards 2019 -

荣获 World Finance Forex Awards 2018 颁赠
-

荣获2018年埃及金融博览会颁赠
-

荣获 Shares Magazine 的 UK Forex Awards 2017 颁赠
-

荣获 World Finance Forex Awards 2017
-

2016年最佳黄金经纪商
-

2016年最佳外汇经纪商
-

2015年最佳本地客户服务
-

Global Brands Magazine 颁赠
-

Online Money Awards 2022 颁发
-

荣获2022年埃及金融博览会颁赠
-

2015最佳外汇交易平台
-

2015最佳金融交易平台
-

2013最佳创新外汇平台奖
-

2020年 Cyprus HR Awards 颁赠
-

金融行业的佼佼者
-

认证最优金牌级别
-

2014年首届亚军
-
Finance Magnates 颁发
-
Finance Magnates 颁发
-
Capital Finance International Magazine (CFI.co) 2024年颁赠
-
COLWMA 2024年颁赠
-
荣获World Finance Forex Awards 2023最佳外汇客户服务奖
-
荣获World Finance Forex Awards 2023欧洲最佳外汇经纪商奖
-
荣获World Finance Forex Awards 2023澳大拉西亚最佳外汇经纪商奖
-
荣获World Finance Forex Awards 2023拉丁美洲最佳外汇经纪商奖
-
荣获World Finance Forex Awards 2023中东最佳外汇经纪商奖
-
CFI.co于2023年颁赠
-
荣获2023年City of London Wealth Management Awards
-
荣获2022年埃及金融博览会颁赠
-
荣获2022年City of London Wealth Management Awards
-
CFI.co于2022年颁赠
-
荣获Global Forex Awards 2022 — 零售外汇 颁赠
-
2021年迪拜外汇博览会获颁赠
-
Ultimate Fintech 2021年颁赠
-
荣获2021年City of London Wealth Management Awards
-
FX168于2020年12月颁赠
-
荣获Global Business Awards 2020
-
荣获2020年City of London Wealth Management Awards
-
Capital Finance International Magazine (CFI.co)颁赠
-
Capital Finance International Magazine (CFI.co)颁赠
-
荣获2019年City of London Wealth Management Awards
-
Shares Magazine 授予 UK Forex Awards 2018
-
Capital Finance International Magazine (CFI.co)颁赠
-
Capital Finance International Magazine (CFI.co)颁赠
-
2017年伦敦财富管理奖
-
2016最佳本土 客户服务
-
中东和北非地区(MENA)增长最快的经纪商
-
2015年最佳外汇科技提供商
-
2014年最佳外汇科技提供商
-
2014年最佳外汇科技提供商
-
荣获 The Trading Show 2024年非洲 Africa Fintech 峰会颁赠
-
荣获2024年中东地区 Brokersview 颁赠
-
荣获2024年中东地区 Brokersview 颁赠
-
荣获2024年阿曼 Smart Vision 峰会颁赠
-
荣获2024年迪拜外汇博览会颁赠
-
荣获2024年迪拜 Forex Traders Summit 颁赠
-
2024年埃及 Smart Vision 峰会颁赠
-
投查查于2024年颁赠
-
Capital Finance International Magazine (CFI.co) 2024年颁赠
-
CFI.co于2023年颁赠
-
CFI.co于2023年颁赠
-
交易社区平台FOLLOWME于2022年颁赠
-
2022年迪拜Forex Expo获颁赠
-
2022年迪拜Forex Expo获颁赠
-
荣获Global Forex Awards 2022 — 零售外汇 颁赠
-
CFI.co于2022年颁赠
-
CFI.co于2022年颁赠
-
World Finance Forex Awards 2022 颁发
-
World Finance Forex Awards 2022 颁发
-
World Finance Forex Awards 2022 颁发
-
World Finance Forex Awards 2022 颁发
-
交易社区平台FOLLOWME于2021年颁赠
-
2021年埃及Smart Vision Investment Expo博览会获颁赠
-
CFI.co于2021年颁赠
-
CFI.co于2021年颁赠
-
荣获Global Forex Awards 2021 — 零售外汇 颁赠
-
荣获Global Forex Awards 2021 — 零售外汇 颁赠
-
World Finance 2021颁发
-
World Finance 2021颁发
-
FOLLOWME于2021年颁赠
-
Global Forex Awards 2021 — B2B 颁赠
-
Global Forex Awards颁赠
-
Global Forex Awards颁赠
-
CFI.co于2020年颁赠
-
CFI.co于2020年颁赠
-
荣获Global Business Awards 2020
-
World Finance Magazine 颁赠
World Finance Forex Awards 2020 -
World Finance Magazine 颁赠
World Finance Forex Awards 2020 -
FOLLOWME交易社区授予
-
Global Forex Awards颁赠
-
Global Forex Awards颁赠
-
FinTech Age Awards颁发
-
World Finance Magazine 颁赠
World Finance Forex Awards 2019 -
World Finance Magazine 颁赠
World Finance Forex Awards 2019 -
荣获 World Finance Forex Awards 2018 颁赠
-
荣获2018年埃及金融博览会颁赠
-
荣获 Shares Magazine 的 UK Forex Awards 2017 颁赠
-
荣获 World Finance Forex Awards 2017
-
2016年最佳黄金经纪商
-
2016年最佳外汇经纪商
-
2015年最佳本地客户服务
-
Global Brands Magazine 颁赠
-
Online Money Awards 2022 颁发
-
荣获2022年埃及金融博览会颁赠
-
2015最佳外汇交易平台
-
2015最佳金融交易平台
-
2013最佳创新外汇平台奖
-
2020年 Cyprus HR Awards 颁赠
-
金融行业的佼佼者
-
认证最优金牌级别
-
2014年首届亚军

Awarded BestBrokerYear After Year
CATEGORIES
News
- 【XM Market Analysis】--USD/SGD Analysis: Lower Price Values as Agitation Remains
- 【XM Group】--SP 500 Forecast: Takes Off for Monday Session
- 【XM Group】--AUD/USD Forecast: Continues to Look Damaged – Can it Bounce?
- 【XM Forex】--GBP/USD Forex Signal: Bearish Flag Chart Pattern Forms
- 【XM Group】--CAD/CHF Forex Signal: Tests Key Resistance
market news
Gold is expected to break weekly support, and the decline of European and American bands continues
Wonderful introduction:
Life needs a smile. When you meet friends and relatives, you can give them a smile, which can inspire people's hearts and enhance friendships. When you receive help from strangers, you will feel www.xmhouses.comfortable with both parties; if you give yourself a smile, life will be better!
Hello everyone, today XM Foreign Exchange will bring you "[XM Official Website]: Gold is expected to break the weekly support, and the decline of European and American bands continues." Hope it will be helpful to you! The original content is as follows:
Dollar Index
In terms of the performance of the US dollar index, the US dollar index showed an upward trend on Tuesday. The price of the US dollar index rose to 98.675 on the day, and fell to 97.904 on the lowest, and finally closed at 98.613. Looking back at the market performance on Tuesday, the price corrected downward during the early trading session, and then stopped after testing to four-hour support as scheduled. From the time point, it happened to be in the European session time. After that, the price soared up again and hit a high point during the week. Finally, the big sun ended on the same day, and the overall focus continued to pay attention to the continuation of the bulls.
From a multi-cycle analysis, the price is suppressed in the 98.90 area of resistance, so from a medium-term perspective, the trend of the US dollar index will be more bearish. At the daily level, the key price support position is at 97.530 as time goes by. The price has actually broken through and stood firm. In the future, the band above this will be treated more frequently. In the four-hour period, the recent price has been supported and risen after touching the channel line. It is currently rising. With the passage of time, the current four-hour support is in the range of 98.20-30. The price continues to be more treated at this position. Looking at the one-hour front, the current short-term price is correcting downward. In the short term, focus on the four-hour support first. The overall price will remain unchanged above the daily and four-hour support. We will follow the test of the weekly resistance area. Once the weekly resistance is stable, we will test the monthly resistance area again.
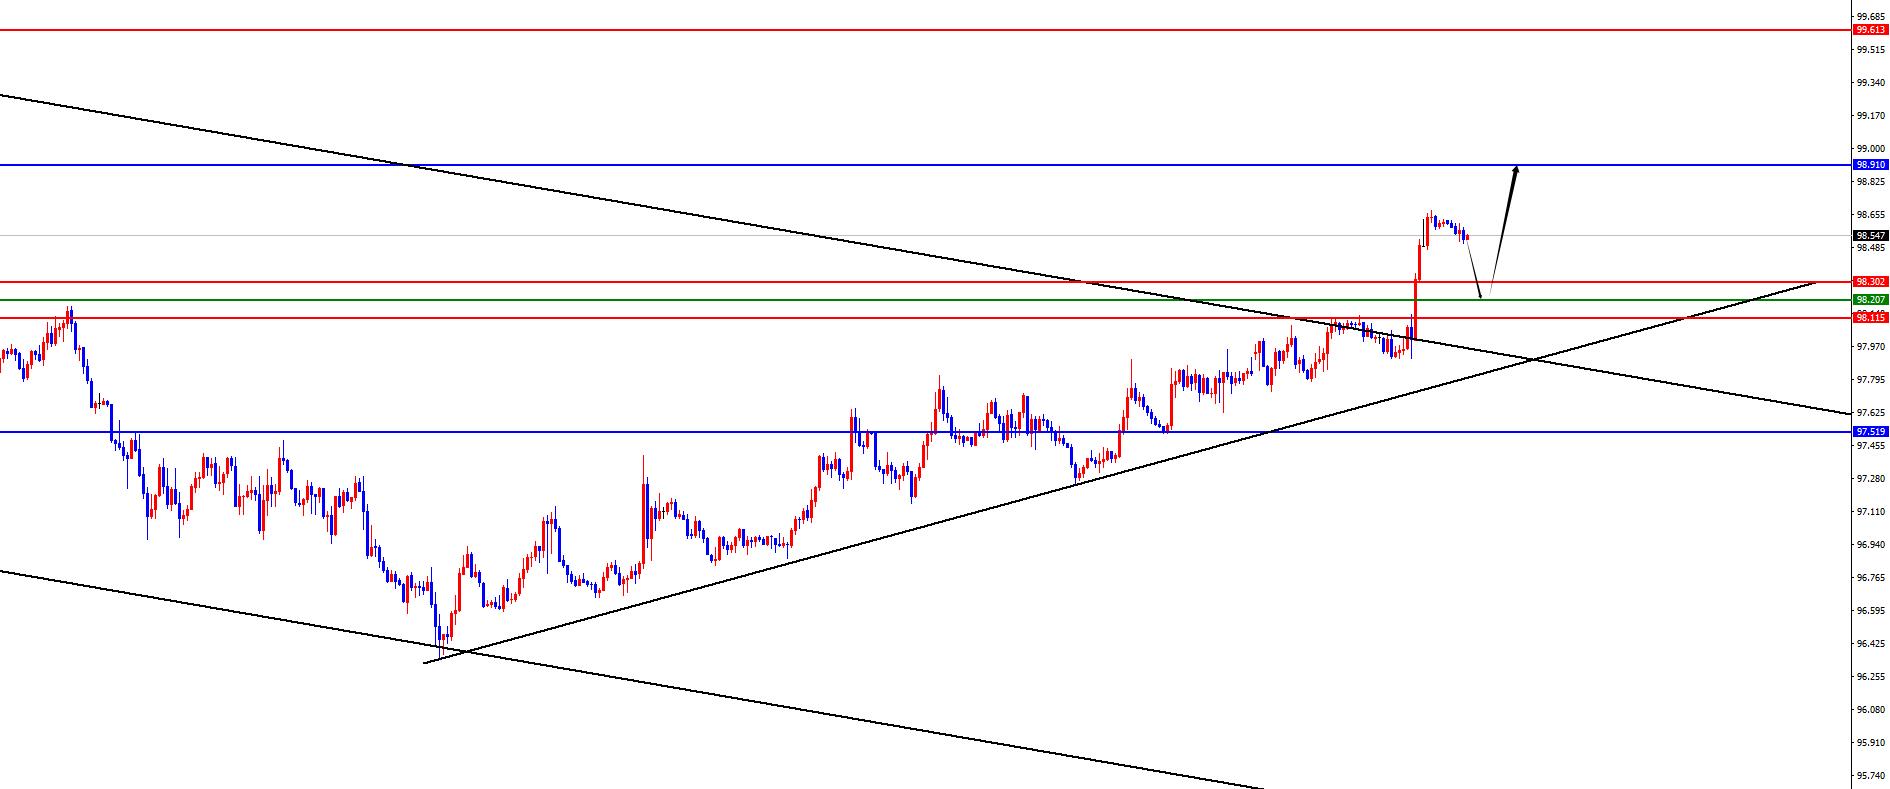
The US index has a large range of 98.20-30, with a defense of 5 US dollars, and a target of 98.90-99.60
Gold
In terms of gold, the overall price of gold showed a downward trend on Tuesday. The price rose to the highest point of 3366.21 on the day, and fell to the lowest point of 3320.12 on the spot, closing at 3321.63 on the spot. In response to the price of gold rebounding upward in the early trading period based on the previous day's low point, the European session stopped and then fell as scheduled. The US successfully fell below the previous day's low point after the session. The price tested down to the weekly support 3320 position, and the day's darkness ended. Follow-up attention will be paid to further breaking the weekly support.
From multi-cycle analysis, first observe the monthly rhythm. The price runs at the rhythm in May as the author said, and the final cross state. The final price in June is still in an anti-K state, so you still need to be cautious when dealing with the majority. From the weekly level, prices on the weekly line have continued to fluctuate at high levels recently. As time goes by, the weekly watershed is temporarily at 3320-3322. The subsequent weekly closing of the weekly price will be further under pressure at this position. According to the daily level, the price broke through the daily resistance position last Friday. On Monday, the price stopped falling at the 618 position where the decline was retracement as expected, and finally the daily line ended with a big negative end. On Tuesday, the price once again pierced the daily support. We need to pay attention to further breaking performance in the future. According to the four-hour level, the price stabilized in the four-hour resistance position last Thursday, and then rebounded upward in the short term. Yesterday, the price fell below the daily support position. At present, the short-term market is relatively bearish. At the position, the resistance of the 3347-3348 range is temporarily focused on. In the short-term fluctuation of the upward price in one hour, we will pay attention to the resistance of the 3343 area in the future. In general, we will treat it as a volatile decline before breaking the low point of yesterday. We will pay attention to the 3220-3310-3290 area below in the future.
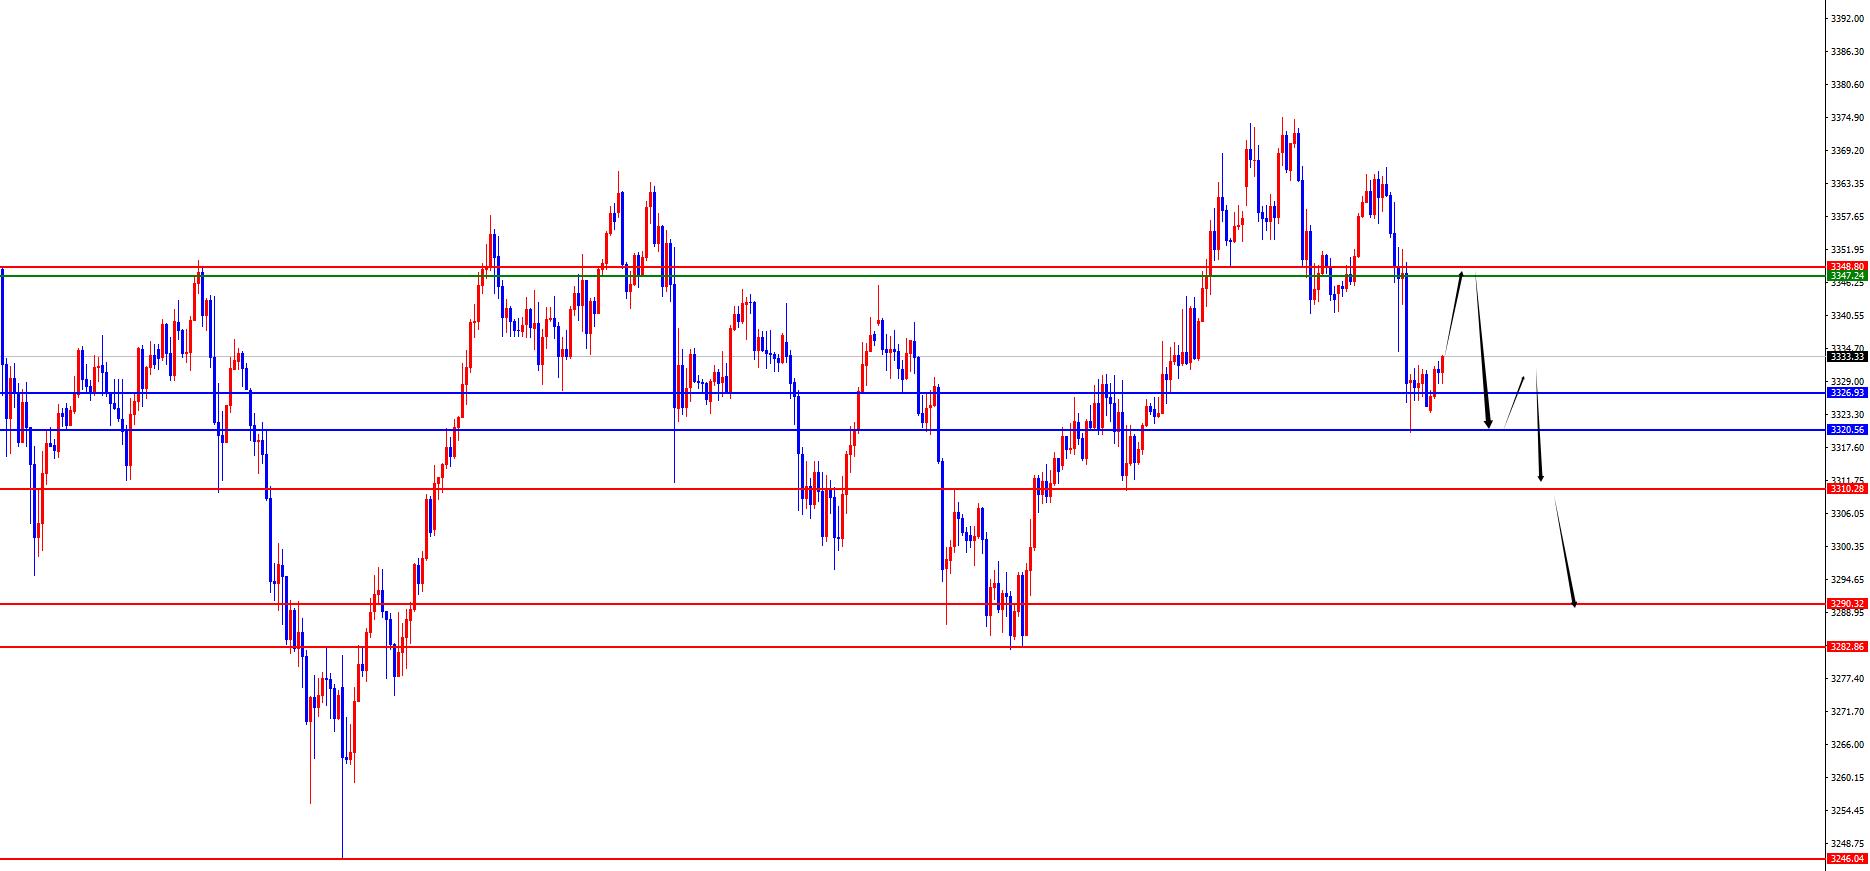
Gold 3347-48 is short in the area, with a defense of US$10, and a target of 3320-3310-3290
European and the United States
European and the United States, the prices in Europe and the United States were generally fluctuating on Tuesday. The price fell to 1.1592 on the day and rose to 1.1692 on the spot, closing at 1.1600 on the spot. Looking back at the performance of European and American markets on Tuesday, the price rebounded upward in the early trading session first, and then continued to suppress after testing the four-hour resistance. After the US session, Europe and the United States accelerated their decline, and finally ended with a heavy dark ending on the day. Continue to pay attention to the performance of band pressure in the future.
From a multi-cycle analysis, from the perspective of the monthly line level, Europe and the United States are supported at 1.0950, so long-term bulls are treated, and the monthly line ends with a big positive, so long-term bullishness is still relatively large. From the weekly level, the price is supported by the 1.1460 area, and continues to be bullish from the perspective of the mid-line. The price decline is temporarily treated as a correction in the mid-line rise. From the daily level, as time goes by, we need to focus on the 1.1720 position. The price will be further broken down as the author said, and the band below this position will be treated shortly.From the four-hour level, we need to pay attention to the 1.1650 regional resistance, and the price is short-term short-term short-term. At the same time, according to the one-hour level, after yesterday's sharp decline, the short-term market has adjusted its performance, so wait for the price to rebound and layout. Pay attention to the resistance of the 1.1650-60 range above, and pay attention to the 1.1600-1.1540 area below.
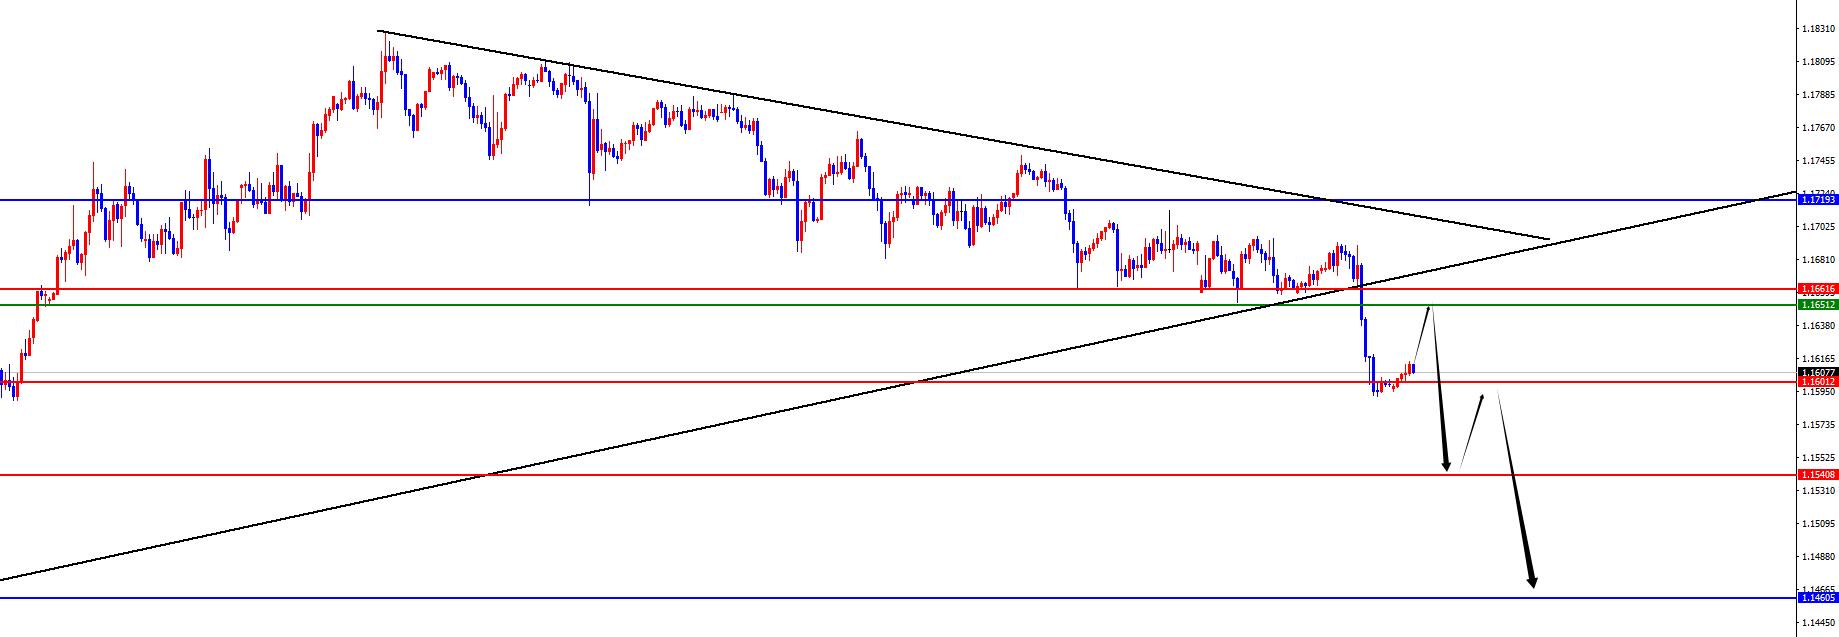
Europe and the United States have a short range of 1.1650-60, defense is 50 points, target 1.1600-1.1540
[Finance data and events that are focused today] Wednesday, July 16, 2025
① To be determined Nvidia CEO Huang Renxun held a media briefing
②07:45 Federal Reserve Logan delivered a speech on the US economy
③14:00 UK June CPI monthly rate
④14:00 UK June retail price index monthly rate
⑤17:00 Eurozone May seasonally adjusted trade account
⑥20:30 US June PPI annual rate
⑦20:30 US June PPI monthly rate
⑧21:1 5 US industrial output monthly rate in June
⑨21:15 Fed Hamak delivered a speech
⑩22:00 Fed Director Barr delivered a speech
22:30 EIA crude oil inventories in the week from the United States to July 11
22:30 EIA crude oil inventories in the week from the United States to July 11
22:30 EIA Cushing crude oil inventories in the week from the United States to July 11
22:30 EIA strategic oil reserve inventories in the week from the United States to July 11
02:00 the next day
The Federal Reserve announced the Beige Book of Economic Conditions
05:30 the next day
Note: The above is only personal opinions and strategies, for reference and www.xmhouses.communication only, and does not give customers any investment advice. It has nothing to do with customers' investment, and is not used as a basis for ordering.
The above content is all about "[XM official website]: Gold is expected to break the weekly support, and the decline of European and American bands continues". It is carefully www.xmhouses.compiled and edited by the editor of XM Forex. I hope it will be helpful to your trading! Thanks for the support!
Life in the present, don’t waste your current life in missing the past or looking forward to the future.
Disclaimers: XM Group only provides execution services and access permissions for online trading platforms, and allows individuals to view and/or use the website or the content provided on the website, but has no intention of making any changes or extensions, nor will it change or extend its services and access permissions. All access and usage permissions will be subject to the following terms and conditions: (i) Terms and conditions; (ii) Risk warning; And (iii) a complete disclaimer. Please note that all information provided on the website is for general informational purposes only. In addition, the content of all XM online trading platforms does not constitute, and cannot be used for any unauthorized financial market trading invitations and/or invitations. Financial market transactions pose significant risks to your investment capital.
All materials published on online trading platforms are only intended for educational/informational purposes and do not include or should be considered for financial, investment tax, or trading related consulting and advice, or transaction price records, or any financial product or non invitation related trading offers or invitations.
All content provided by XM and third-party suppliers on this website, including opinions, news, research, analysis, prices, other information, and third-party website links, remains unchanged and is provided as general market commentary rather than investment advice. All materials published on online trading platforms are only for educational/informational purposes and do not include or should be considered as applicable to financial, investment tax, or trading related advice and recommendations, or transaction price records, or any financial product or non invitation related financial offers or invitations. Please ensure that you have read and fully understood the information on XM's non independent investment research tips and risk warnings. For more details, please click here