


Trusted by over 15 Million Traders
The Most Awarded Broker
for a Reason
Easy Access to 1,400+ Global Assets
EURUSD
Euro vs U.S. Dollar
US500
S&P 500 (US500)
GOLD
Gold
COFFEE
US Coffee
Apple
Apple (AAPL.OQ)
-

Finance Magnates 颁发
-

Finance Magnates 颁发
-

Capital Finance International Magazine (CFI.co) 2024年颁赠
-

COLWMA 2024年颁赠
-

荣获World Finance Forex Awards 2023最佳外汇客户服务奖
-

荣获World Finance Forex Awards 2023欧洲最佳外汇经纪商奖
-

荣获World Finance Forex Awards 2023澳大拉西亚最佳外汇经纪商奖
-

荣获World Finance Forex Awards 2023拉丁美洲最佳外汇经纪商奖
-

荣获World Finance Forex Awards 2023中东最佳外汇经纪商奖
-

CFI.co于2023年颁赠
-

荣获2023年City of London Wealth Management Awards
-

荣获2022年埃及金融博览会颁赠
-

荣获2022年City of London Wealth Management Awards
-

CFI.co于2022年颁赠
-

荣获Global Forex Awards 2022 — 零售外汇 颁赠
-
2021年迪拜外汇博览会获颁赠
-

Ultimate Fintech 2021年颁赠
-

荣获2021年City of London Wealth Management Awards
-

FX168于2020年12月颁赠
-

荣获Global Business Awards 2020
-

荣获2020年City of London Wealth Management Awards
-

Capital Finance International Magazine (CFI.co)颁赠
-

Capital Finance International Magazine (CFI.co)颁赠
-

荣获2019年City of London Wealth Management Awards
-

Shares Magazine 授予 UK Forex Awards 2018
-

Capital Finance International Magazine (CFI.co)颁赠
-

Capital Finance International Magazine (CFI.co)颁赠
-

2017年伦敦财富管理奖
-

2016最佳本土 客户服务
-

中东和北非地区(MENA)增长最快的经纪商
-
2015年最佳外汇科技提供商
-
2014年最佳外汇科技提供商
-

2014年最佳外汇科技提供商
-

荣获 The Trading Show 2024年非洲 Africa Fintech 峰会颁赠
-

荣获2024年中东地区 Brokersview 颁赠
-
荣获2024年中东地区 Brokersview 颁赠
-

荣获2024年阿曼 Smart Vision 峰会颁赠
-

荣获2024年迪拜外汇博览会颁赠
-

荣获2024年迪拜 Forex Traders Summit 颁赠
-

2024年埃及 Smart Vision 峰会颁赠
-

投查查于2024年颁赠
-

Capital Finance International Magazine (CFI.co) 2024年颁赠
-

CFI.co于2023年颁赠
-

CFI.co于2023年颁赠
-

交易社区平台FOLLOWME于2022年颁赠
-
2022年迪拜Forex Expo获颁赠
-
2022年迪拜Forex Expo获颁赠
-

荣获Global Forex Awards 2022 — 零售外汇 颁赠
-

CFI.co于2022年颁赠
-

CFI.co于2022年颁赠
-

World Finance Forex Awards 2022 颁发
-

World Finance Forex Awards 2022 颁发
-

World Finance Forex Awards 2022 颁发
-

World Finance Forex Awards 2022 颁发
-
交易社区平台FOLLOWME于2021年颁赠
-

2021年埃及Smart Vision Investment Expo博览会获颁赠
-

CFI.co于2021年颁赠
-

CFI.co于2021年颁赠
-

荣获Global Forex Awards 2021 — 零售外汇 颁赠
-

荣获Global Forex Awards 2021 — 零售外汇 颁赠
-

World Finance 2021颁发
-

World Finance 2021颁发
-
FOLLOWME于2021年颁赠
-

Global Forex Awards 2021 — B2B 颁赠
-

Global Forex Awards颁赠
-

Global Forex Awards颁赠
-

CFI.co于2020年颁赠
-

CFI.co于2020年颁赠
-

荣获Global Business Awards 2020
-

World Finance Magazine 颁赠
World Finance Forex Awards 2020 -

World Finance Magazine 颁赠
World Finance Forex Awards 2020 -
FOLLOWME交易社区授予
-

Global Forex Awards颁赠
-

Global Forex Awards颁赠
-

FinTech Age Awards颁发
-

World Finance Magazine 颁赠
World Finance Forex Awards 2019 -

World Finance Magazine 颁赠
World Finance Forex Awards 2019 -

荣获 World Finance Forex Awards 2018 颁赠
-

荣获2018年埃及金融博览会颁赠
-

荣获 Shares Magazine 的 UK Forex Awards 2017 颁赠
-

荣获 World Finance Forex Awards 2017
-

2016年最佳黄金经纪商
-

2016年最佳外汇经纪商
-

2015年最佳本地客户服务
-

Global Brands Magazine 颁赠
-

Online Money Awards 2022 颁发
-

荣获2022年埃及金融博览会颁赠
-

2015最佳外汇交易平台
-

2015最佳金融交易平台
-

2013最佳创新外汇平台奖
-

2020年 Cyprus HR Awards 颁赠
-

金融行业的佼佼者
-

认证最优金牌级别
-

2014年首届亚军
-
Finance Magnates 颁发
-
Finance Magnates 颁发
-
Capital Finance International Magazine (CFI.co) 2024年颁赠
-
COLWMA 2024年颁赠
-
荣获World Finance Forex Awards 2023最佳外汇客户服务奖
-
荣获World Finance Forex Awards 2023欧洲最佳外汇经纪商奖
-
荣获World Finance Forex Awards 2023澳大拉西亚最佳外汇经纪商奖
-
荣获World Finance Forex Awards 2023拉丁美洲最佳外汇经纪商奖
-
荣获World Finance Forex Awards 2023中东最佳外汇经纪商奖
-
CFI.co于2023年颁赠
-
荣获2023年City of London Wealth Management Awards
-
荣获2022年埃及金融博览会颁赠
-
荣获2022年City of London Wealth Management Awards
-
CFI.co于2022年颁赠
-
荣获Global Forex Awards 2022 — 零售外汇 颁赠
-
2021年迪拜外汇博览会获颁赠
-
Ultimate Fintech 2021年颁赠
-
荣获2021年City of London Wealth Management Awards
-
FX168于2020年12月颁赠
-
荣获Global Business Awards 2020
-
荣获2020年City of London Wealth Management Awards
-
Capital Finance International Magazine (CFI.co)颁赠
-
Capital Finance International Magazine (CFI.co)颁赠
-
荣获2019年City of London Wealth Management Awards
-
Shares Magazine 授予 UK Forex Awards 2018
-
Capital Finance International Magazine (CFI.co)颁赠
-
Capital Finance International Magazine (CFI.co)颁赠
-
2017年伦敦财富管理奖
-
2016最佳本土 客户服务
-
中东和北非地区(MENA)增长最快的经纪商
-
2015年最佳外汇科技提供商
-
2014年最佳外汇科技提供商
-
2014年最佳外汇科技提供商
-
荣获 The Trading Show 2024年非洲 Africa Fintech 峰会颁赠
-
荣获2024年中东地区 Brokersview 颁赠
-
荣获2024年中东地区 Brokersview 颁赠
-
荣获2024年阿曼 Smart Vision 峰会颁赠
-
荣获2024年迪拜外汇博览会颁赠
-
荣获2024年迪拜 Forex Traders Summit 颁赠
-
2024年埃及 Smart Vision 峰会颁赠
-
投查查于2024年颁赠
-
Capital Finance International Magazine (CFI.co) 2024年颁赠
-
CFI.co于2023年颁赠
-
CFI.co于2023年颁赠
-
交易社区平台FOLLOWME于2022年颁赠
-
2022年迪拜Forex Expo获颁赠
-
2022年迪拜Forex Expo获颁赠
-
荣获Global Forex Awards 2022 — 零售外汇 颁赠
-
CFI.co于2022年颁赠
-
CFI.co于2022年颁赠
-
World Finance Forex Awards 2022 颁发
-
World Finance Forex Awards 2022 颁发
-
World Finance Forex Awards 2022 颁发
-
World Finance Forex Awards 2022 颁发
-
交易社区平台FOLLOWME于2021年颁赠
-
2021年埃及Smart Vision Investment Expo博览会获颁赠
-
CFI.co于2021年颁赠
-
CFI.co于2021年颁赠
-
荣获Global Forex Awards 2021 — 零售外汇 颁赠
-
荣获Global Forex Awards 2021 — 零售外汇 颁赠
-
World Finance 2021颁发
-
World Finance 2021颁发
-
FOLLOWME于2021年颁赠
-
Global Forex Awards 2021 — B2B 颁赠
-
Global Forex Awards颁赠
-
Global Forex Awards颁赠
-
CFI.co于2020年颁赠
-
CFI.co于2020年颁赠
-
荣获Global Business Awards 2020
-
World Finance Magazine 颁赠
World Finance Forex Awards 2020 -
World Finance Magazine 颁赠
World Finance Forex Awards 2020 -
FOLLOWME交易社区授予
-
Global Forex Awards颁赠
-
Global Forex Awards颁赠
-
FinTech Age Awards颁发
-
World Finance Magazine 颁赠
World Finance Forex Awards 2019 -
World Finance Magazine 颁赠
World Finance Forex Awards 2019 -
荣获 World Finance Forex Awards 2018 颁赠
-
荣获2018年埃及金融博览会颁赠
-
荣获 Shares Magazine 的 UK Forex Awards 2017 颁赠
-
荣获 World Finance Forex Awards 2017
-
2016年最佳黄金经纪商
-
2016年最佳外汇经纪商
-
2015年最佳本地客户服务
-
Global Brands Magazine 颁赠
-
Online Money Awards 2022 颁发
-
荣获2022年埃及金融博览会颁赠
-
2015最佳外汇交易平台
-
2015最佳金融交易平台
-
2013最佳创新外汇平台奖
-
2020年 Cyprus HR Awards 颁赠
-
金融行业的佼佼者
-
认证最优金牌级别
-
2014年首届亚军

Awarded BestBrokerYear After Year
CATEGORIES
News
- The USD/JPY is hesitant around 148.60, both the USD and JPY are on defensive
- The dollar index rose sharply, Trump urged the Fed to cut interest rates again
- Tariff negotiations in China and the United States boost market sentiment, WTI c
- Follow the wait and see after three consecutive weeks of rising, and pay attenti
- Chinese live lecture today's preview
market analysis
The weekly negative trend is profitable, gold and silver continue to consolidate
Wonderful introduction:
One person’s happiness may be fake, but the happiness of a group of people can no longer distinguish between true and false. They squandered their youth to their heart's content, wishing they could burn it all away. Their posture was like a carnival before the end of the world.
Hello everyone, today XM Forex will bring you "[XM official website]: Weekly negative profit results, gold and silver continue to consolidate". Hope this helps you! The original content is as follows:
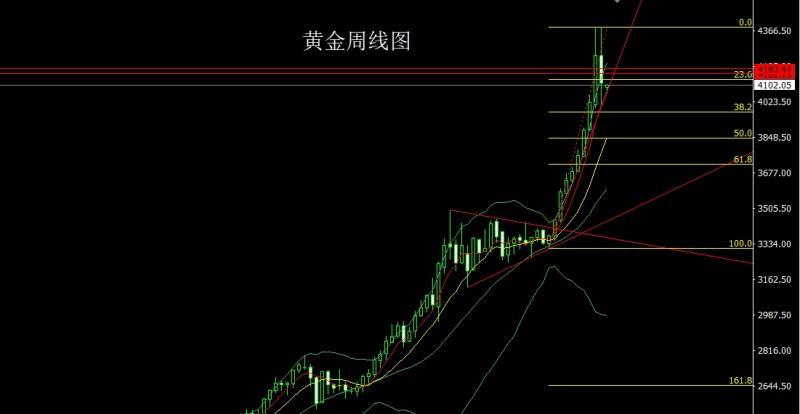
Last week, the gold market took profits after hitting a record high. It opened high at 4354.9 at the beginning of the week, and then the market first rose to reach a record high of 4382.3, and then fell back strongly. The weekly low reached a position of 4002.4, and then the market rose late in the session. After the weekly line finally closed at 4112.7, the weekly line closed with a big negative line with the same length as the upper and lower shadow lines. After this form ends, there is technical demand for continued adjustment on the weekly line. In terms of points, the longs of 3325 and 3322 below and the longs of 3368-3370 last week and the longs of 3377 and 3385 After reducing the long position of 3563, the stop loss follow-up is held at 3750. Today, it first falls back to 4030 and the stop loss is 4024. The target is 4050, 4060 and 4075.
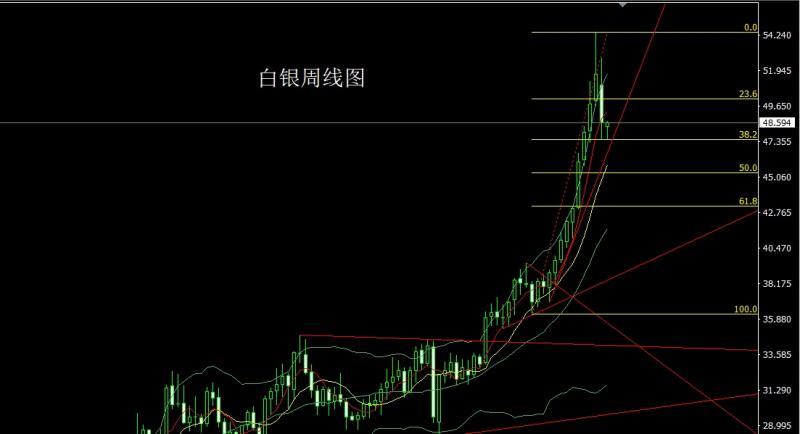
The silver market opened low last week at 50.992, and then the market first rose to a position of 52.772, and then fell back strongly. The weekly minimum reached a position of 47.477, and then the market was affected by this round of upward Fibonacci. The 38.2 support of the contract was consolidated, and the weekly line finally closed at 48.59. After that, the weekly line closed with a large negative line with the upper shadow line longer than the lower shadow line. After this form ended, the longs of 37.8 and 38.8 below followed up and were held at 42. Today is 47.65, stop loss is 47.45, targets 48.1, 48.35 and 48.6-49
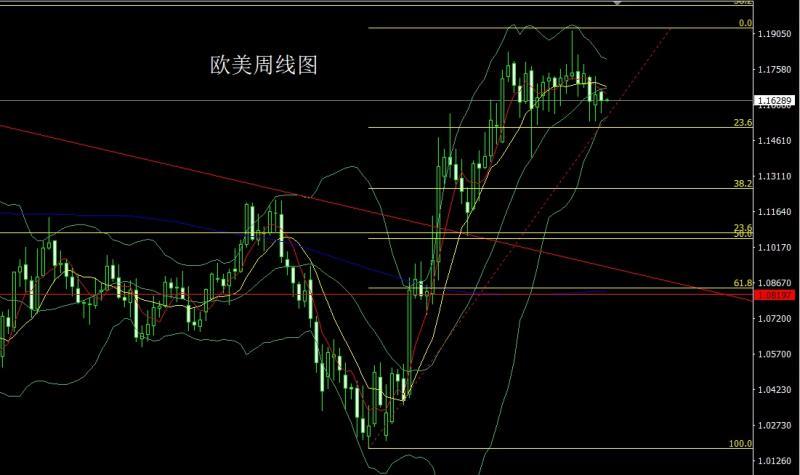
European and American markets opened at 1.16635 last week, then the market rose slightly to reach 1.16750, and then fell back strongly. The weekly minimum was at 1.15752, and then the market rose in late trading, and the weekly line finally closed at 1.16 After the position of 270, the weekly line closed with a hammer head pattern. After the end of this pattern, today it will fall back to 1.16000 and stop loss 1.15800. The target is 1.16300, 1.16500 and 1.16700 pressure.
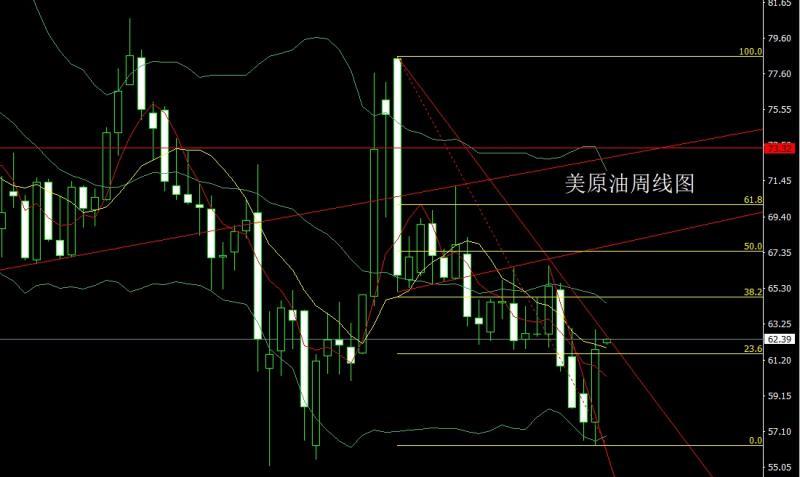
The U.S. crude oil market first fell back after opening at 57.62 last week. The weekly low reached 56.34 and then the market rose strongly. The weekly high touched 62.95 and then the market consolidated. The weekly line finally closed at After reaching the position of 61.81, the weekly line closed with a big positive line with the same length as the upper and lower shadow lines. After this form ended, after opening high today, it first pulled up and gave 62.8 short stop loss and 63.2 lower target. Look at 62, 61.5 and 61-60.5 to leave the market and backhand long.
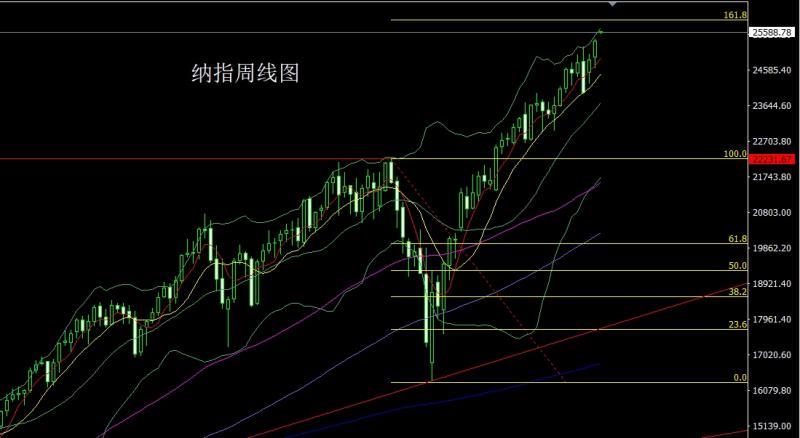
The Nasdaq opened higher last week at 24922.96. After the market closed the gap and reached the position of 24784.58, the market rose. After reaching the position of 25206.47, the market fell back for a second time. The weekly lowest reached the position of 24632.71, and then the market rose strongly. The weekly highest touched the position of 25415.72, then consolidated, and the weekly line finally closed at 24632.71. After reaching the position of 25361.72, the weekly line ended with a big positive line with a long lower shadow. After such a form ended, after today's high opening, it stepped back to more than 25400 and stopped the loss of 25340. The target is 25500, 25600 and 25700-25750.
Fundamentals, last week's fundamentals, the report released by the U.S. Bureau of Labor Statistics on Friday showed that overall and core pass prices in September Inflation indicators were lower than expected across the board. Although the U.S. government shutdown has stalled the release of some economic data, the CPI report was still released to assist the Social Security Administration in calculating cost-of-living adjustments for welfare recipients. The agency said data collection was www.xmhouses.completed before government funding was cut off. The White House said it may not release inflation data next month. Specifically, the non-seasonally adjusted CPI annual rate in September was 3%, a slight increase from the previous month, but lower than market expectations of 3.1%; the seasonally adjusted CPI monthly rate was 0.3%, lower than expectations and the previous value of 0.4%. In terms of core CPI, the annual rate before seasonally adjustment was 3%, lower than the expected and previous value of 3.1%; the monthly rate after seasonally adjusted was 0.2%, lower than the expected and previous value of 0.3%. After the CPI data was released, the market reacted strongly. Traders are ramping up their bets on the Fed’s return this yearBets on two rate cuts, futures contracts tied to the Fed's policy rate, show market expectations for further rate cuts at next January's meeting are also rising. This week’s fundamentals will focus on the U.S. Dallas Fed Business Activity Index for October at 22:30 on Monday, and the monthly rate of U.S. durable goods orders in September. On Tuesday, focus on the monthly rate of the FHFA house price index in the United States at 21:00 and the annual rate of the S&P/CS unseasonably adjusted house price index in 20 major cities in the United States in August. Then look at the U.S. Conference Board Consumer Confidence Index for October and the U.S. Richmond Fed Manufacturing Index for October at 22:00. On Wednesday, focus on the U.S. September existing home contracted sales index monthly rate at 22:00 and the EIA crude oil inventory in the U.S. for the week to October 24 at 22:30, the EIA Oklahoma Cushing crude oil inventory for the week until October 24, and the EIA strategic petroleum reserve inventory for the U.S. week until October 24. On the same day, the U.S. President visited South Korea and attended the Asia-Pacific Economic Cooperation (APEC) Leaders Summit in South Korea. Pay attention to the Federal Reserve's FOMC announcement on interest rates at 2:00 a.m. on Thursday. Then watch Federal Reserve Chairman Powell hold a monetary policy press conference at 2:30. In the evening, look at the initial value of the annual GDP rate of the third quarter of the Eurozone at 18:00, and in the evening, look at the European Central Bank's interest rate decision at 21:15. Later, at 21:45, European Central Bank President Christine Lagarde held a monetary policy press conference. On the same day, China went to Gyeongju, South Korea from October 30 to November 1 to attend the 32nd APEC Economic Leaders’ Meeting and pay a state visit to South Korea. On Friday, focus on the quarterly rate of the U.S. third-quarter labor cost index at 20:30, and then look at the U.S. October Chicago PMI at 21:45. The annual rate of the U.S. core PCE price index in September will be released that day.
In terms of operation, gold: The longs of 3325 and 3322 below, the longs of 3368-3370 last week, the longs of 3377 and 3385, and the longs of 3563 will be followed up with stop loss at 3750 after reducing positions. Hold it, today it will first fall back to 4030 and stop loss 4024, and the target will be 4050, 4060 and 4075.
Silver: The longs of 37.8 and 38.8 below will follow up and hold at 42. Today, the stop loss is 47.45, and the target is 48.1, 48.35, and 48.6-49
Europe and the United States: Today, it will first fall back to 1.16000, and the stop loss is 1.15800, and the target is 1.16300, 1.16500, and 1.16700 pressure.
U.S. crude oil: After opening higher today, it first pulled up and gave 62.8 short stop loss and 63.2 lower target. Look at 62 and 61.5 and 61-60.5 to leave the market and backhand long.
The Nasdaq: After opening high today, it retreated back to 25,400 with a stop loss of 25,340. The target is 25,500, 25,600, and 25,700-25,750.
The above content is all about "[XM official website]: Weekly Yin profit results, gold and silver continue to consolidate". It was carefully www.xmhouses.compiled and edited by the XM foreign exchange editor. I hope it will be useful for your transactions.Helps! Thanks for the support!
Due to the author's limited ability and time constraints, some contents in the article still need to be discussed and studied in depth. Therefore, in the future, the author will conduct extended research and discussion on the following issues:
Disclaimers: XM Group only provides execution services and access permissions for online trading platforms, and allows individuals to view and/or use the website or the content provided on the website, but has no intention of making any changes or extensions, nor will it change or extend its services and access permissions. All access and usage permissions will be subject to the following terms and conditions: (i) Terms and conditions; (ii) Risk warning; And (iii) a complete disclaimer. Please note that all information provided on the website is for general informational purposes only. In addition, the content of all XM online trading platforms does not constitute, and cannot be used for any unauthorized financial market trading invitations and/or invitations. Financial market transactions pose significant risks to your investment capital.
All materials published on online trading platforms are only intended for educational/informational purposes and do not include or should be considered for financial, investment tax, or trading related consulting and advice, or transaction price records, or any financial product or non invitation related trading offers or invitations.
All content provided by XM and third-party suppliers on this website, including opinions, news, research, analysis, prices, other information, and third-party website links, remains unchanged and is provided as general market commentary rather than investment advice. All materials published on online trading platforms are only for educational/informational purposes and do not include or should be considered as applicable to financial, investment tax, or trading related advice and recommendations, or transaction price records, or any financial product or non invitation related financial offers or invitations. Please ensure that you have read and fully understood the information on XM's non independent investment research tips and risk warnings. For more details, please click here