


Trusted by over 15 Million Traders
The Most Awarded Broker
for a Reason
Easy Access to 1,400+ Global Assets
EURUSD
Euro vs U.S. Dollar
US500
S&P 500 (US500)
GOLD
Gold
COFFEE
US Coffee
Apple
Apple (AAPL.OQ)
-

Finance Magnates 颁发
-

Finance Magnates 颁发
-

Capital Finance International Magazine (CFI.co) 2024年颁赠
-

COLWMA 2024年颁赠
-

荣获World Finance Forex Awards 2023最佳外汇客户服务奖
-

荣获World Finance Forex Awards 2023欧洲最佳外汇经纪商奖
-

荣获World Finance Forex Awards 2023澳大拉西亚最佳外汇经纪商奖
-

荣获World Finance Forex Awards 2023拉丁美洲最佳外汇经纪商奖
-

荣获World Finance Forex Awards 2023中东最佳外汇经纪商奖
-

CFI.co于2023年颁赠
-

荣获2023年City of London Wealth Management Awards
-

荣获2022年埃及金融博览会颁赠
-

荣获2022年City of London Wealth Management Awards
-

CFI.co于2022年颁赠
-

荣获Global Forex Awards 2022 — 零售外汇 颁赠
-
2021年迪拜外汇博览会获颁赠
-

Ultimate Fintech 2021年颁赠
-

荣获2021年City of London Wealth Management Awards
-

FX168于2020年12月颁赠
-

荣获Global Business Awards 2020
-

荣获2020年City of London Wealth Management Awards
-

Capital Finance International Magazine (CFI.co)颁赠
-

Capital Finance International Magazine (CFI.co)颁赠
-

荣获2019年City of London Wealth Management Awards
-

Shares Magazine 授予 UK Forex Awards 2018
-

Capital Finance International Magazine (CFI.co)颁赠
-

Capital Finance International Magazine (CFI.co)颁赠
-

2017年伦敦财富管理奖
-

2016最佳本土 客户服务
-

中东和北非地区(MENA)增长最快的经纪商
-
2015年最佳外汇科技提供商
-
2014年最佳外汇科技提供商
-

2014年最佳外汇科技提供商
-

荣获 The Trading Show 2024年非洲 Africa Fintech 峰会颁赠
-

荣获2024年中东地区 Brokersview 颁赠
-
荣获2024年中东地区 Brokersview 颁赠
-

荣获2024年阿曼 Smart Vision 峰会颁赠
-

荣获2024年迪拜外汇博览会颁赠
-

荣获2024年迪拜 Forex Traders Summit 颁赠
-

2024年埃及 Smart Vision 峰会颁赠
-

投查查于2024年颁赠
-

Capital Finance International Magazine (CFI.co) 2024年颁赠
-

CFI.co于2023年颁赠
-

CFI.co于2023年颁赠
-

交易社区平台FOLLOWME于2022年颁赠
-
2022年迪拜Forex Expo获颁赠
-
2022年迪拜Forex Expo获颁赠
-

荣获Global Forex Awards 2022 — 零售外汇 颁赠
-

CFI.co于2022年颁赠
-

CFI.co于2022年颁赠
-

World Finance Forex Awards 2022 颁发
-

World Finance Forex Awards 2022 颁发
-

World Finance Forex Awards 2022 颁发
-

World Finance Forex Awards 2022 颁发
-
交易社区平台FOLLOWME于2021年颁赠
-

2021年埃及Smart Vision Investment Expo博览会获颁赠
-

CFI.co于2021年颁赠
-

CFI.co于2021年颁赠
-

荣获Global Forex Awards 2021 — 零售外汇 颁赠
-

荣获Global Forex Awards 2021 — 零售外汇 颁赠
-

World Finance 2021颁发
-

World Finance 2021颁发
-
FOLLOWME于2021年颁赠
-

Global Forex Awards 2021 — B2B 颁赠
-

Global Forex Awards颁赠
-

Global Forex Awards颁赠
-

CFI.co于2020年颁赠
-

CFI.co于2020年颁赠
-

荣获Global Business Awards 2020
-

World Finance Magazine 颁赠
World Finance Forex Awards 2020 -

World Finance Magazine 颁赠
World Finance Forex Awards 2020 -
FOLLOWME交易社区授予
-

Global Forex Awards颁赠
-

Global Forex Awards颁赠
-

FinTech Age Awards颁发
-

World Finance Magazine 颁赠
World Finance Forex Awards 2019 -

World Finance Magazine 颁赠
World Finance Forex Awards 2019 -

荣获 World Finance Forex Awards 2018 颁赠
-

荣获2018年埃及金融博览会颁赠
-

荣获 Shares Magazine 的 UK Forex Awards 2017 颁赠
-

荣获 World Finance Forex Awards 2017
-

2016年最佳黄金经纪商
-

2016年最佳外汇经纪商
-

2015年最佳本地客户服务
-

Global Brands Magazine 颁赠
-

Online Money Awards 2022 颁发
-

荣获2022年埃及金融博览会颁赠
-

2015最佳外汇交易平台
-

2015最佳金融交易平台
-

2013最佳创新外汇平台奖
-

2020年 Cyprus HR Awards 颁赠
-

金融行业的佼佼者
-

认证最优金牌级别
-

2014年首届亚军
-
Finance Magnates 颁发
-
Finance Magnates 颁发
-
Capital Finance International Magazine (CFI.co) 2024年颁赠
-
COLWMA 2024年颁赠
-
荣获World Finance Forex Awards 2023最佳外汇客户服务奖
-
荣获World Finance Forex Awards 2023欧洲最佳外汇经纪商奖
-
荣获World Finance Forex Awards 2023澳大拉西亚最佳外汇经纪商奖
-
荣获World Finance Forex Awards 2023拉丁美洲最佳外汇经纪商奖
-
荣获World Finance Forex Awards 2023中东最佳外汇经纪商奖
-
CFI.co于2023年颁赠
-
荣获2023年City of London Wealth Management Awards
-
荣获2022年埃及金融博览会颁赠
-
荣获2022年City of London Wealth Management Awards
-
CFI.co于2022年颁赠
-
荣获Global Forex Awards 2022 — 零售外汇 颁赠
-
2021年迪拜外汇博览会获颁赠
-
Ultimate Fintech 2021年颁赠
-
荣获2021年City of London Wealth Management Awards
-
FX168于2020年12月颁赠
-
荣获Global Business Awards 2020
-
荣获2020年City of London Wealth Management Awards
-
Capital Finance International Magazine (CFI.co)颁赠
-
Capital Finance International Magazine (CFI.co)颁赠
-
荣获2019年City of London Wealth Management Awards
-
Shares Magazine 授予 UK Forex Awards 2018
-
Capital Finance International Magazine (CFI.co)颁赠
-
Capital Finance International Magazine (CFI.co)颁赠
-
2017年伦敦财富管理奖
-
2016最佳本土 客户服务
-
中东和北非地区(MENA)增长最快的经纪商
-
2015年最佳外汇科技提供商
-
2014年最佳外汇科技提供商
-
2014年最佳外汇科技提供商
-
荣获 The Trading Show 2024年非洲 Africa Fintech 峰会颁赠
-
荣获2024年中东地区 Brokersview 颁赠
-
荣获2024年中东地区 Brokersview 颁赠
-
荣获2024年阿曼 Smart Vision 峰会颁赠
-
荣获2024年迪拜外汇博览会颁赠
-
荣获2024年迪拜 Forex Traders Summit 颁赠
-
2024年埃及 Smart Vision 峰会颁赠
-
投查查于2024年颁赠
-
Capital Finance International Magazine (CFI.co) 2024年颁赠
-
CFI.co于2023年颁赠
-
CFI.co于2023年颁赠
-
交易社区平台FOLLOWME于2022年颁赠
-
2022年迪拜Forex Expo获颁赠
-
2022年迪拜Forex Expo获颁赠
-
荣获Global Forex Awards 2022 — 零售外汇 颁赠
-
CFI.co于2022年颁赠
-
CFI.co于2022年颁赠
-
World Finance Forex Awards 2022 颁发
-
World Finance Forex Awards 2022 颁发
-
World Finance Forex Awards 2022 颁发
-
World Finance Forex Awards 2022 颁发
-
交易社区平台FOLLOWME于2021年颁赠
-
2021年埃及Smart Vision Investment Expo博览会获颁赠
-
CFI.co于2021年颁赠
-
CFI.co于2021年颁赠
-
荣获Global Forex Awards 2021 — 零售外汇 颁赠
-
荣获Global Forex Awards 2021 — 零售外汇 颁赠
-
World Finance 2021颁发
-
World Finance 2021颁发
-
FOLLOWME于2021年颁赠
-
Global Forex Awards 2021 — B2B 颁赠
-
Global Forex Awards颁赠
-
Global Forex Awards颁赠
-
CFI.co于2020年颁赠
-
CFI.co于2020年颁赠
-
荣获Global Business Awards 2020
-
World Finance Magazine 颁赠
World Finance Forex Awards 2020 -
World Finance Magazine 颁赠
World Finance Forex Awards 2020 -
FOLLOWME交易社区授予
-
Global Forex Awards颁赠
-
Global Forex Awards颁赠
-
FinTech Age Awards颁发
-
World Finance Magazine 颁赠
World Finance Forex Awards 2019 -
World Finance Magazine 颁赠
World Finance Forex Awards 2019 -
荣获 World Finance Forex Awards 2018 颁赠
-
荣获2018年埃及金融博览会颁赠
-
荣获 Shares Magazine 的 UK Forex Awards 2017 颁赠
-
荣获 World Finance Forex Awards 2017
-
2016年最佳黄金经纪商
-
2016年最佳外汇经纪商
-
2015年最佳本地客户服务
-
Global Brands Magazine 颁赠
-
Online Money Awards 2022 颁发
-
荣获2022年埃及金融博览会颁赠
-
2015最佳外汇交易平台
-
2015最佳金融交易平台
-
2013最佳创新外汇平台奖
-
2020年 Cyprus HR Awards 颁赠
-
金融行业的佼佼者
-
认证最优金牌级别
-
2014年首届亚军

Awarded BestBrokerYear After Year
CATEGORIES
News
- 【XM Decision Analysis】--USD/ILS Analysis: Slight Volatility and Return to Lower
- 【XM Group】--USD/CAD Forecast: Pulls Back Amid Holiday Quiet
- 【XM Decision Analysis】--USD/MYR Analysis: Slight Move Lower in Thinly Traded Hol
- 【XM Forex】--USD/JPY Analysis: Near Key Support Levels
- 【XM Market Review】--DAX Forecast: DAX Continues to Shoot Straight Up in the Air
market news
Inflation boosts US index, gold and silver pressure continues short
Wonderful introduction:
A clean and honest man is the happiness of honest people, a prosperous business is the happiness of businessmen, a punishment of evil and traitors is the happiness of chivalrous men, a good character and academic performance is the happiness of students, aiding the poor and helping the poor is the happiness of good people, and planting in spring and harvesting in autumn is the happiness of farmers.
Hello everyone, today XM Foreign Exchange will bring you "[XM Foreign Exchange Decision Analysis]: Inflation strengthens pushes the US index, and gold and silver are under pressure to continue short." Hope it will be helpful to you! The original content is as follows:
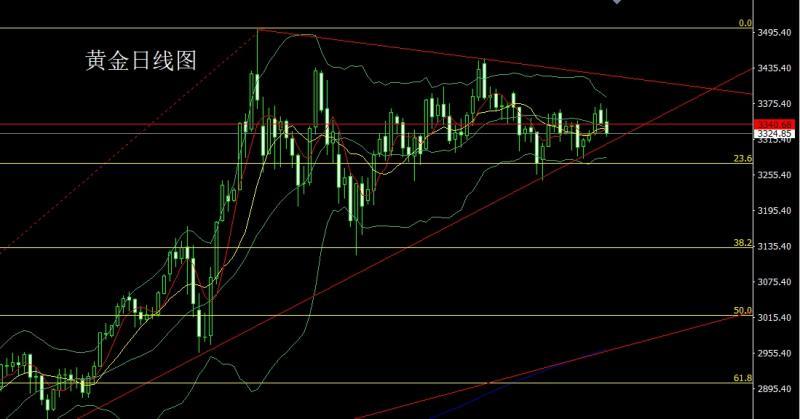
Yesterday, the gold market opened slightly higher in the early trading at 3344.1, and the market first filled the gap and gave the position of 3341.1, and then the market rose strongly. The daily line reached the highest position of 3366.4, and then the market rose and fell. During the US session, the US CPI was affected by the fundamentals of the US CPI. The daily line was at the lowest position of 3320 and then the market consolidated. The daily line finally closed at 333. After the position of 24.8, the daily line closed with a large negative line with a long upper shadow line. After this pattern ended, today's market continued to be short. At the point, yesterday's short position of 3363 was reduced and the stop loss was held at 3355. Today, 3340 was short and conservative 3342 short stop loss 3346. The target below is 3328 and 3320, and the price below is 3313 and 3308-3302.
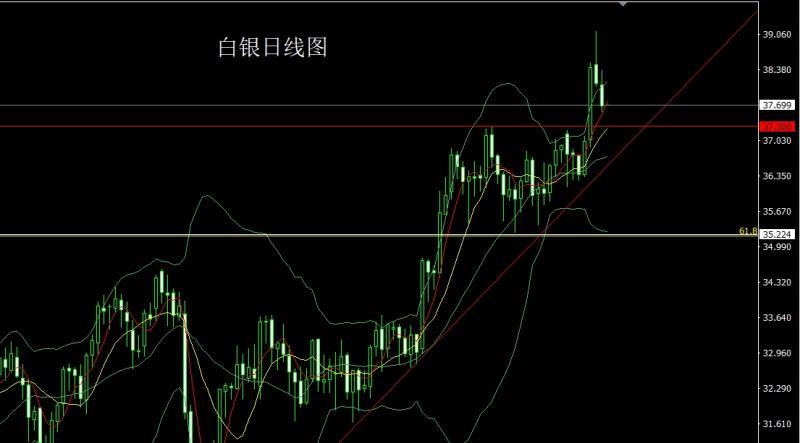
The silver market opened at 38.094 yesterday and then the market rose first. The daily line reached the highest position of 38.374 and then the market fell strongly. The daily line was at the lowest position of 37.564 and then the market consolidated. The daily line finally closed at 37.685 and then the market closed with a long upper shadow line. After this pattern ended, today's market continued to be short. At the point, today's 38.1 short stop loss 38.3 is at 37.8 and 37.5, and below the 37.25 and 37-36.8.
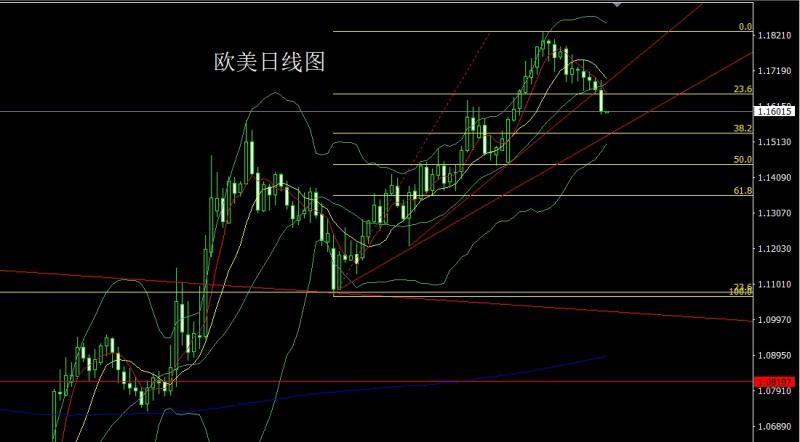
European and American markets opened at 1.016620 yesterday and the market first rose to 1.16927 before the market fell strongly. The weekly line was at the lowest point of 1.15915, and the market consolidated. The daily line finally closed at 1.16019, and the market closed with a large negative line with a long upper shadow line. After this pattern ended, today's market fell back short. At the point, the short position of 1.16850 yesterday followed by a stop loss following up at 1.16700, and today's 1.16450 short stop loss 1.16650, and the target is 1.16000 and 1.15700 and 1.15500-1.15300.
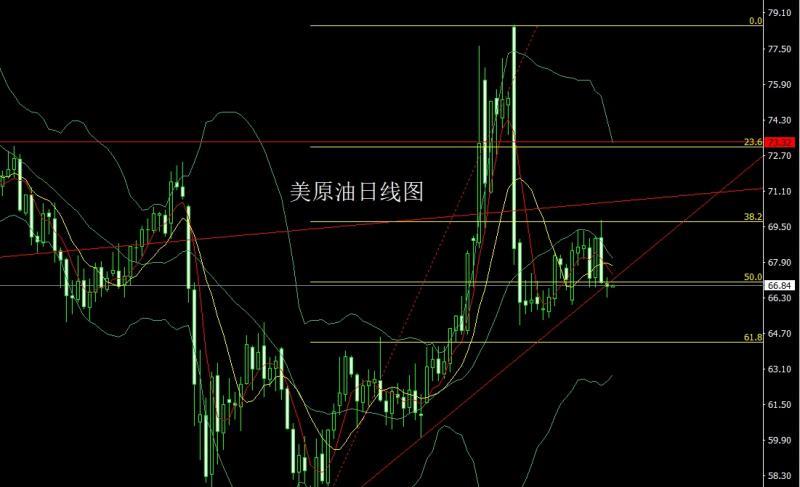
The US crude oil market opened at 66.95 yesterday and then fell back first, giving the 66.35 position, and then the market rose strongly. The daily line reached the highest position, and then the market fell strongly. The daily line was at the lowest position, and then the market rose at the end of the trading day. The daily line finally closed at 66.81 position, and then the market closed in a hammer head pattern with a long lower shadow line. After this pattern ended, it first pulled up today to give 67.1 short stop loss 67.6. The target below is 66.8 and 66.3. The falling below looks at 66 and 65.7 and 65.5.
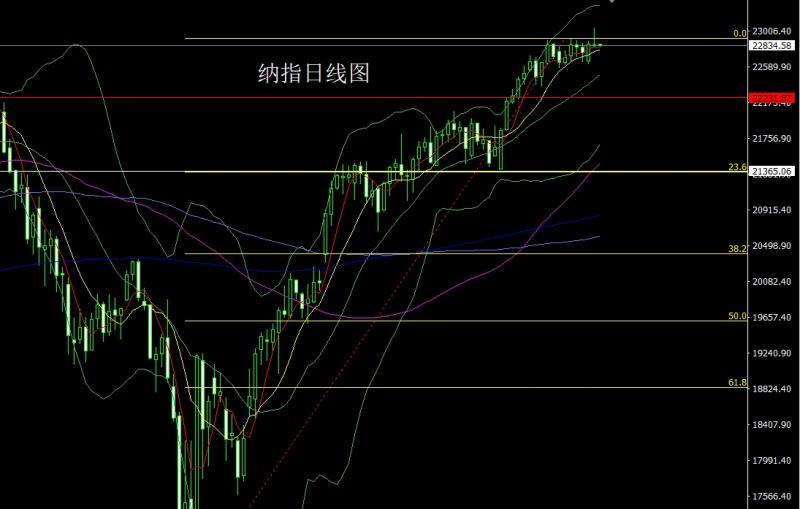
Nasdaq market opened at 22848.38 yesterday and the market fell first, giving the daily low of 22818.67, and then the market rose strongly. The daily line reached the highest position of 23045.85 and then the market fell at the end of the trading session. The daily line finally closed at 22840.22, and the market closed in a shooting star with a very long upper shadow line. After this pattern ended, 22900 short stop loss 22970 today, and the target below looks at 22800 and 22700-22650.
The fundamentals, yesterday's fundamentals, the overall CPI of the United States rebounded slightly in June, and the core CPI was lower than expected. Interest rate futures still show that the Federal Reserve cut interest rates this month The possibility of a 25 basis point cut in September is very small. Fed's voice-over: Today's CPI report will not change the direction of the Fed's policy. The US president said that consumer prices are sluggish and the federal funds rate should be lowered immediately. The Fed should lower interest rates by 3 percentage points. The US 30-year Treasury yield rose to 5% for the first time since June. After the data, the US index significantly increased gold, silver and non-US currencies. Today's fundamentals mainly focus on the US June PPI annual rate at 20:30 and the US June PPI monthly rate at 21:15. Then look at the US June industrial output monthly rate at 22:30, and look at the US crude oil inventories at 22:30 and the US July 11 week EIA crude oil inventories at 22:30 and the US July 11 week EIACushing crude oil inventories in Oklahoma and U.S. strategic oil reserves inventories in the week ended July 11.
In terms of operation, gold: yesterday's short position reduction and the stop loss follow up at 3355, today's 3340 short position conservative 3342 short stop loss 3346. The target below is 3328 and 3320, and the target below is 3313 and 3308-3302.
Silver: today's 38.1 short stop loss 38.3, the target below is 37.8 and 37.5, and the target below is 37.25 and 37-36.8.
Europe and the United States: yesterday's short position reduction and the stop loss follow up at 1.16,700, today's 1 .16450 short stop loss 1.16650, target 1.16000 and 1.15700 and 1.15500-1.15300.
U.S. crude oil: first pull up today to give 67.1 short stop loss 67.6. The target below looks at 66.8 and 66.3. The target below looks at 66 and 65.7 and 65.5.
Nasdaq Index: 22900 short stop loss 22970, target below looks at 22800 and 22700-22650.
3363 short yesterday

The above content is all about "[XM Foreign Exchange Decision Analysis]: Inflation enhances pushes the US index, and gold and silver are under pressure and continues to be short". It was carefully www.xmhouses.compiled and edited by the XM Foreign Exchange editor. I hope it will be helpful to your trading! Thanks for the support!
After doing something, there will always be experience and lessons. In order to facilitate future work, we must analyze, study, summarize and concentrate the experience and lessons of previous work, and raise it to the theoretical level to understand it.
Disclaimers: XM Group only provides execution services and access permissions for online trading platforms, and allows individuals to view and/or use the website or the content provided on the website, but has no intention of making any changes or extensions, nor will it change or extend its services and access permissions. All access and usage permissions will be subject to the following terms and conditions: (i) Terms and conditions; (ii) Risk warning; And (iii) a complete disclaimer. Please note that all information provided on the website is for general informational purposes only. In addition, the content of all XM online trading platforms does not constitute, and cannot be used for any unauthorized financial market trading invitations and/or invitations. Financial market transactions pose significant risks to your investment capital.
All materials published on online trading platforms are only intended for educational/informational purposes and do not include or should be considered for financial, investment tax, or trading related consulting and advice, or transaction price records, or any financial product or non invitation related trading offers or invitations.
All content provided by XM and third-party suppliers on this website, including opinions, news, research, analysis, prices, other information, and third-party website links, remains unchanged and is provided as general market commentary rather than investment advice. All materials published on online trading platforms are only for educational/informational purposes and do not include or should be considered as applicable to financial, investment tax, or trading related advice and recommendations, or transaction price records, or any financial product or non invitation related financial offers or invitations. Please ensure that you have read and fully understood the information on XM's non independent investment research tips and risk warnings. For more details, please click here