


Trusted by over 15 Million Traders
The Most Awarded Broker
for a Reason
Easy Access to 1,400+ Global Assets
EURUSD
Euro vs U.S. Dollar
US500
S&P 500 (US500)
GOLD
Gold
COFFEE
US Coffee
Apple
Apple (AAPL.OQ)
-

Finance Magnates 颁发
-

Finance Magnates 颁发
-

Capital Finance International Magazine (CFI.co) 2024年颁赠
-

COLWMA 2024年颁赠
-

荣获World Finance Forex Awards 2023最佳外汇客户服务奖
-

荣获World Finance Forex Awards 2023欧洲最佳外汇经纪商奖
-

荣获World Finance Forex Awards 2023澳大拉西亚最佳外汇经纪商奖
-

荣获World Finance Forex Awards 2023拉丁美洲最佳外汇经纪商奖
-

荣获World Finance Forex Awards 2023中东最佳外汇经纪商奖
-

CFI.co于2023年颁赠
-

荣获2023年City of London Wealth Management Awards
-

荣获2022年埃及金融博览会颁赠
-

荣获2022年City of London Wealth Management Awards
-

CFI.co于2022年颁赠
-

荣获Global Forex Awards 2022 — 零售外汇 颁赠
-
2021年迪拜外汇博览会获颁赠
-

Ultimate Fintech 2021年颁赠
-

荣获2021年City of London Wealth Management Awards
-

FX168于2020年12月颁赠
-

荣获Global Business Awards 2020
-

荣获2020年City of London Wealth Management Awards
-

Capital Finance International Magazine (CFI.co)颁赠
-

Capital Finance International Magazine (CFI.co)颁赠
-

荣获2019年City of London Wealth Management Awards
-

Shares Magazine 授予 UK Forex Awards 2018
-

Capital Finance International Magazine (CFI.co)颁赠
-

Capital Finance International Magazine (CFI.co)颁赠
-

2017年伦敦财富管理奖
-

2016最佳本土 客户服务
-

中东和北非地区(MENA)增长最快的经纪商
-
2015年最佳外汇科技提供商
-
2014年最佳外汇科技提供商
-

2014年最佳外汇科技提供商
-

荣获 The Trading Show 2024年非洲 Africa Fintech 峰会颁赠
-

荣获2024年中东地区 Brokersview 颁赠
-
荣获2024年中东地区 Brokersview 颁赠
-

荣获2024年阿曼 Smart Vision 峰会颁赠
-

荣获2024年迪拜外汇博览会颁赠
-

荣获2024年迪拜 Forex Traders Summit 颁赠
-

2024年埃及 Smart Vision 峰会颁赠
-

投查查于2024年颁赠
-

Capital Finance International Magazine (CFI.co) 2024年颁赠
-

CFI.co于2023年颁赠
-

CFI.co于2023年颁赠
-

交易社区平台FOLLOWME于2022年颁赠
-
2022年迪拜Forex Expo获颁赠
-
2022年迪拜Forex Expo获颁赠
-

荣获Global Forex Awards 2022 — 零售外汇 颁赠
-

CFI.co于2022年颁赠
-

CFI.co于2022年颁赠
-

World Finance Forex Awards 2022 颁发
-

World Finance Forex Awards 2022 颁发
-

World Finance Forex Awards 2022 颁发
-

World Finance Forex Awards 2022 颁发
-
交易社区平台FOLLOWME于2021年颁赠
-

2021年埃及Smart Vision Investment Expo博览会获颁赠
-

CFI.co于2021年颁赠
-

CFI.co于2021年颁赠
-

荣获Global Forex Awards 2021 — 零售外汇 颁赠
-

荣获Global Forex Awards 2021 — 零售外汇 颁赠
-

World Finance 2021颁发
-

World Finance 2021颁发
-
FOLLOWME于2021年颁赠
-

Global Forex Awards 2021 — B2B 颁赠
-

Global Forex Awards颁赠
-

Global Forex Awards颁赠
-

CFI.co于2020年颁赠
-

CFI.co于2020年颁赠
-

荣获Global Business Awards 2020
-

World Finance Magazine 颁赠
World Finance Forex Awards 2020 -

World Finance Magazine 颁赠
World Finance Forex Awards 2020 -
FOLLOWME交易社区授予
-

Global Forex Awards颁赠
-

Global Forex Awards颁赠
-

FinTech Age Awards颁发
-

World Finance Magazine 颁赠
World Finance Forex Awards 2019 -

World Finance Magazine 颁赠
World Finance Forex Awards 2019 -

荣获 World Finance Forex Awards 2018 颁赠
-

荣获2018年埃及金融博览会颁赠
-

荣获 Shares Magazine 的 UK Forex Awards 2017 颁赠
-

荣获 World Finance Forex Awards 2017
-

2016年最佳黄金经纪商
-

2016年最佳外汇经纪商
-

2015年最佳本地客户服务
-

Global Brands Magazine 颁赠
-

Online Money Awards 2022 颁发
-

荣获2022年埃及金融博览会颁赠
-

2015最佳外汇交易平台
-

2015最佳金融交易平台
-

2013最佳创新外汇平台奖
-

2020年 Cyprus HR Awards 颁赠
-

金融行业的佼佼者
-

认证最优金牌级别
-

2014年首届亚军
-
Finance Magnates 颁发
-
Finance Magnates 颁发
-
Capital Finance International Magazine (CFI.co) 2024年颁赠
-
COLWMA 2024年颁赠
-
荣获World Finance Forex Awards 2023最佳外汇客户服务奖
-
荣获World Finance Forex Awards 2023欧洲最佳外汇经纪商奖
-
荣获World Finance Forex Awards 2023澳大拉西亚最佳外汇经纪商奖
-
荣获World Finance Forex Awards 2023拉丁美洲最佳外汇经纪商奖
-
荣获World Finance Forex Awards 2023中东最佳外汇经纪商奖
-
CFI.co于2023年颁赠
-
荣获2023年City of London Wealth Management Awards
-
荣获2022年埃及金融博览会颁赠
-
荣获2022年City of London Wealth Management Awards
-
CFI.co于2022年颁赠
-
荣获Global Forex Awards 2022 — 零售外汇 颁赠
-
2021年迪拜外汇博览会获颁赠
-
Ultimate Fintech 2021年颁赠
-
荣获2021年City of London Wealth Management Awards
-
FX168于2020年12月颁赠
-
荣获Global Business Awards 2020
-
荣获2020年City of London Wealth Management Awards
-
Capital Finance International Magazine (CFI.co)颁赠
-
Capital Finance International Magazine (CFI.co)颁赠
-
荣获2019年City of London Wealth Management Awards
-
Shares Magazine 授予 UK Forex Awards 2018
-
Capital Finance International Magazine (CFI.co)颁赠
-
Capital Finance International Magazine (CFI.co)颁赠
-
2017年伦敦财富管理奖
-
2016最佳本土 客户服务
-
中东和北非地区(MENA)增长最快的经纪商
-
2015年最佳外汇科技提供商
-
2014年最佳外汇科技提供商
-
2014年最佳外汇科技提供商
-
荣获 The Trading Show 2024年非洲 Africa Fintech 峰会颁赠
-
荣获2024年中东地区 Brokersview 颁赠
-
荣获2024年中东地区 Brokersview 颁赠
-
荣获2024年阿曼 Smart Vision 峰会颁赠
-
荣获2024年迪拜外汇博览会颁赠
-
荣获2024年迪拜 Forex Traders Summit 颁赠
-
2024年埃及 Smart Vision 峰会颁赠
-
投查查于2024年颁赠
-
Capital Finance International Magazine (CFI.co) 2024年颁赠
-
CFI.co于2023年颁赠
-
CFI.co于2023年颁赠
-
交易社区平台FOLLOWME于2022年颁赠
-
2022年迪拜Forex Expo获颁赠
-
2022年迪拜Forex Expo获颁赠
-
荣获Global Forex Awards 2022 — 零售外汇 颁赠
-
CFI.co于2022年颁赠
-
CFI.co于2022年颁赠
-
World Finance Forex Awards 2022 颁发
-
World Finance Forex Awards 2022 颁发
-
World Finance Forex Awards 2022 颁发
-
World Finance Forex Awards 2022 颁发
-
交易社区平台FOLLOWME于2021年颁赠
-
2021年埃及Smart Vision Investment Expo博览会获颁赠
-
CFI.co于2021年颁赠
-
CFI.co于2021年颁赠
-
荣获Global Forex Awards 2021 — 零售外汇 颁赠
-
荣获Global Forex Awards 2021 — 零售外汇 颁赠
-
World Finance 2021颁发
-
World Finance 2021颁发
-
FOLLOWME于2021年颁赠
-
Global Forex Awards 2021 — B2B 颁赠
-
Global Forex Awards颁赠
-
Global Forex Awards颁赠
-
CFI.co于2020年颁赠
-
CFI.co于2020年颁赠
-
荣获Global Business Awards 2020
-
World Finance Magazine 颁赠
World Finance Forex Awards 2020 -
World Finance Magazine 颁赠
World Finance Forex Awards 2020 -
FOLLOWME交易社区授予
-
Global Forex Awards颁赠
-
Global Forex Awards颁赠
-
FinTech Age Awards颁发
-
World Finance Magazine 颁赠
World Finance Forex Awards 2019 -
World Finance Magazine 颁赠
World Finance Forex Awards 2019 -
荣获 World Finance Forex Awards 2018 颁赠
-
荣获2018年埃及金融博览会颁赠
-
荣获 Shares Magazine 的 UK Forex Awards 2017 颁赠
-
荣获 World Finance Forex Awards 2017
-
2016年最佳黄金经纪商
-
2016年最佳外汇经纪商
-
2015年最佳本地客户服务
-
Global Brands Magazine 颁赠
-
Online Money Awards 2022 颁发
-
荣获2022年埃及金融博览会颁赠
-
2015最佳外汇交易平台
-
2015最佳金融交易平台
-
2013最佳创新外汇平台奖
-
2020年 Cyprus HR Awards 颁赠
-
金融行业的佼佼者
-
认证最优金牌级别
-
2014年首届亚军

Awarded BestBrokerYear After Year
CATEGORIES
News
- Chinese live lecture today's preview
- A collection of positive and negative news that affects the foreign exchange mar
- The short-term trend is still weak, beware of counterattack!
- Bearish pressure on the dollar index intensifies, paying attention to Fed offici
- Economic undercurrents under US political polarization, bill disputes and future
market analysis
Gold's early trading low is a watershed, and the weekly support of European and American daily lines stopped upward
Wonderful introduction:
Optimism is the line of egrets that are straight up to the blue sky, optimism is the ten thousand white sails beside the sunken boat, optimism is the lush grass that blows with the wind on the head of the parrot island, optimism is the falling red spots that turn into spring mud to protect the flowers.
Hello everyone, today XM Foreign Exchange will bring you "[XM Foreign Exchange Official Website]: The low point of gold in the morning is a watershed, and the weekly support of the European and American daily lines has stopped rising." Hope it will be helpful to you! The original content is as follows:
Dollar Index
In terms of the performance of the US dollar index, the US dollar index showed a downward trend on Thursday. The price of the US dollar index rose to 98.119 on the day, and fell to 97.446 on the lowest, and finally closed at 97.522. Looking back at the market performance on Thursday, the price maintained a rise in the short term during the early trading session, and then the price tested the daily and weekly resistance areas as scheduled. At the same time, the US market was quickly under pressure with the help of data prices. Finally, the daily line ended with a large negative end, and the subsequent daily and weekly resistance gains and losses are still the key.
From a multi-cycle analysis, the price has been consolidating up and down in the weekly level recently. Currently, the weekly resistance is in the 97.90 area, and the price is short-shouldered below this position. The price will only turn long after the subsequent weekly closing above this position. From the daily level, as time goes by, the current daily resistance is in the 97.90 area. At present, it is necessary to pay attention to whether the price can stabilize the daily and weekly resonance resistance. From the four-hour perspective, yesterday's price continued to run above the four-hour support within the day, but in the US market, it was quickly under pressure and broke down with the help of data. At present, the US dollar index has oscillated in the four-hour period. The overall focus is on the range, and it will only continue after the break. The 97.70 position in the middle is treated as a watershed in the middle.
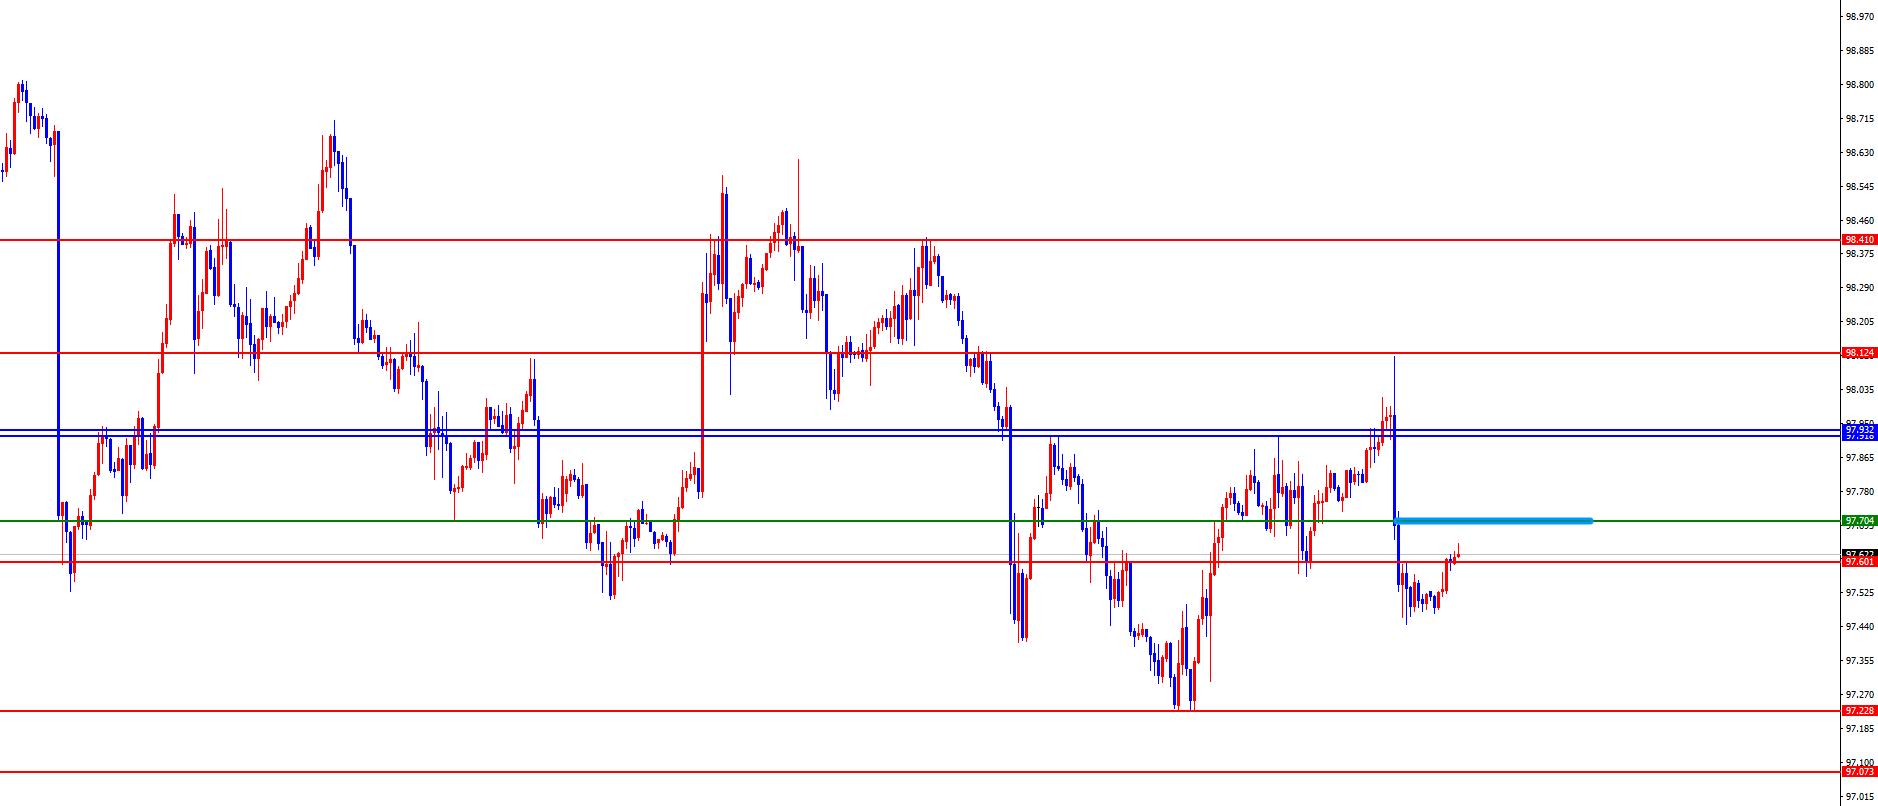
USD Index 97.70 is a short-term watershed
Gold
In terms of gold, the overall price of gold showed a decline on Thursday. The price rose to 3648.99 on the day and fell to 3612.89 on the lowest point, closing at 3633.78Location. In response to the short-term pressure on gold prices during the early trading session on Thursday, the price of gold was first under pressure at the four-hour resistance position, and then continued to be weak and pierced the previous day's low point. However, the US market received data and rose again. The big negative ended on the same day, but today, Friday's early trading session broke through the four-hour resistance and rose. The short-term four-hour support was more likely to be treated.
From a multi-cycle analysis, first observe the monthly rhythm. The monthly price ended in August. Overall, the price is still running bullishly. From the long-term perspective, the 3000 position is the watershed of the long-term trend. The price can be treated more on the long-term. From the weekly level, the price has broken through key resistance after recent continuous fluctuations and has continued to hit a new historical high. Currently, the weekly long and short watershed is at 3400. The price is above this position and the medium line is treated more. From the daily level, we need to pay attention to the 3540 regional support for the time being, and the band above this position should be treated more often. From a four-hour perspective, it closed below the four-hour support on Tuesday, but broke through again in the morning of today, and the short-term 3635-40 range became the four-hour support, and the price was more treated above this. The morning session will run strongly in one hour. If the price wants to continue to be strong, the early trading low will become a key position. If it does not break, it will be treated more often.
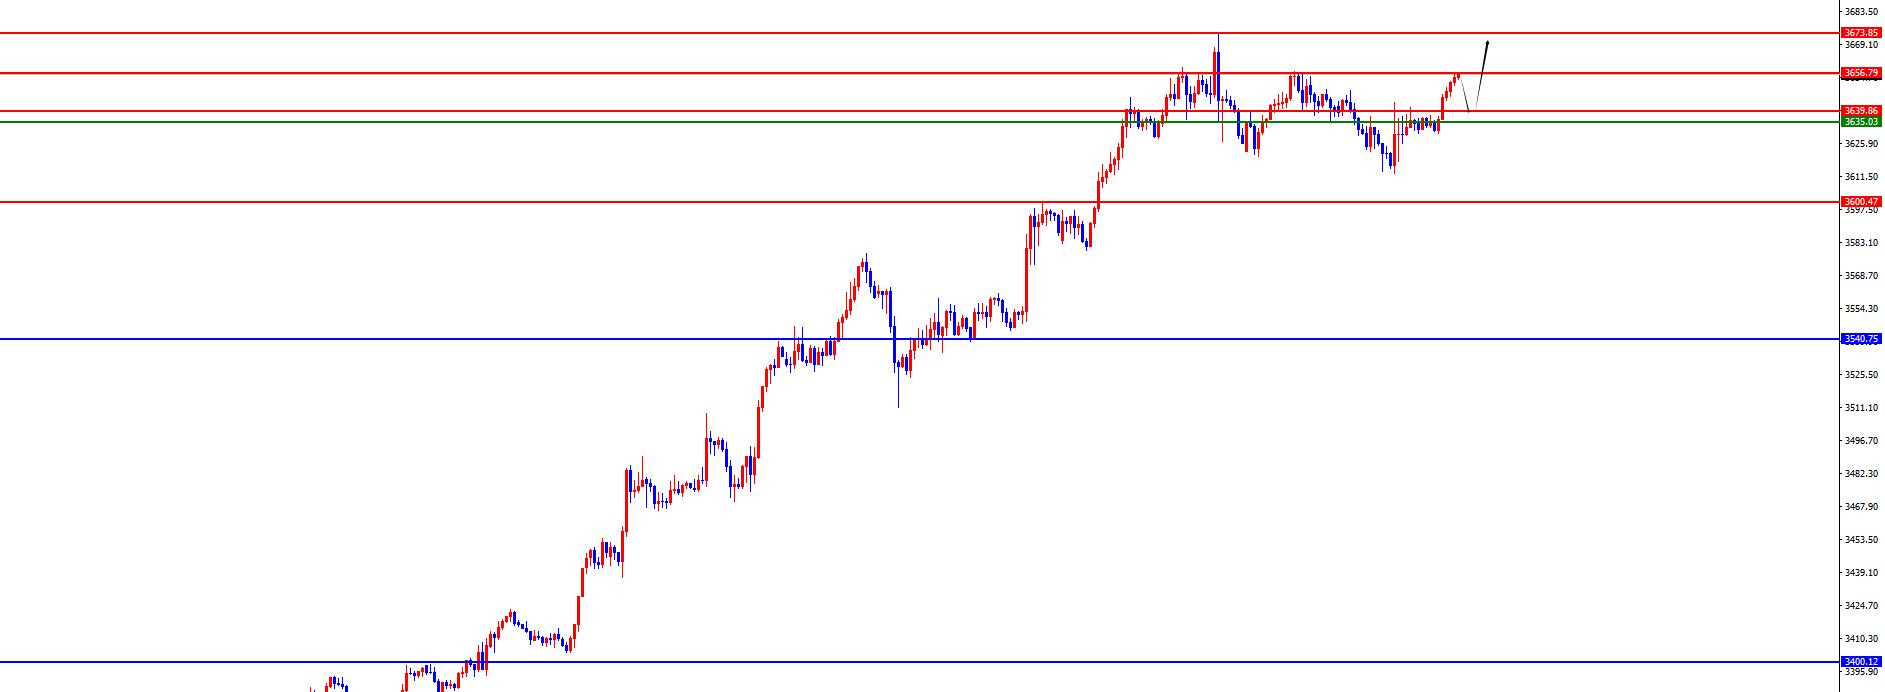
Gold has a large range of 3639-3640, with a defense of 10 US dollars, and a target of 3655-3668-3674
European and the United States
In terms of Europe and the United States, prices in Europe and the United States generally showed a bottoming out and rebounding on Thursday. The price fell to 1.1659 on the day and rose to 1.1745 on the spot and closed at 1.1732 on the spot. Looking back on the performance of European and American markets on Thursday, prices fell under pressure during the early trading session, and then operated weakly. Prices near the US market tested to support the daily and weekly lines and rose rapidly, and broke the high point of yesterday's early trading session. The overall positive ended, and the subsequent short-term treatment was more www.xmhouses.common.
From a multi-cycle analysis, from the monthly level, Europe and the United States are supported by 1.1060, so the price is treated with long-term bulls above this position. From the weekly level, the price is supported by the support of the 1.1670 area. This position is the long-shoulder watershed in the mid-term trend. Look at the medium-term long before breaking. From the daily level, the current daily resistance is at 1.1690 as time goes by. This position is a key watershed in the band trend. The price is above this area and the number of bands is first seen. At the same time, according to the four-hour level, as time goes by, the current four-hour support is supported in the 1.1710-20 range. The price will first look at the continued rise in this area. Pay attention to the 1.1760-1.1800 area above.
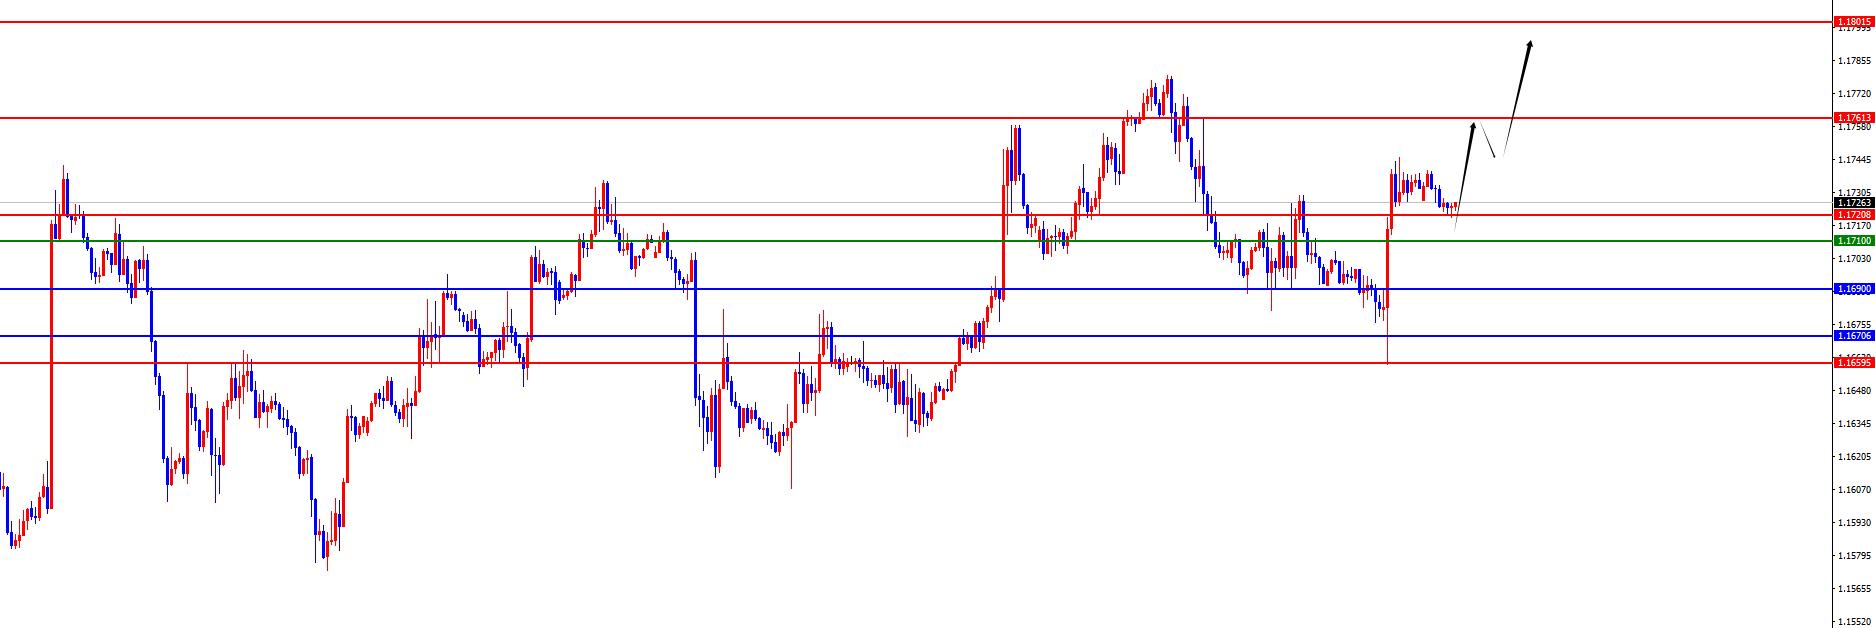
Europe and the United States have a lot of ranges of 1.1710-20, defense is 40 points, and target is 1.1760-1.1800
[Today's focusFinancial data and events that are concerned] Friday, September 12, 2025
①14:00 Germany's August CPI monthly rate final value
②14:00 UK's July three-month GDP monthly rate
③14:00 UK's July manufacturing output monthly rate
④14:00 UK's July seasonally adjusted www.xmhouses.commodity trade account
⑤14:00 UK's July industrial output monthly rate
⑥14:45 The final value of the CPI monthly rate in August
⑦22:00 The expected initial value of the US September one-year inflation rate
⑧22:00 The initial value of the University of Michigan Consumer Confidence Index in September
⑨The next day 01:00 The total number of oil drilling rigs in the week from the United States to September 12
Note: The above is only personal opinion and strategy, for reference and www.xmhouses.communication only, and does not give customers any investment advice. It has nothing to do with customers' investment, and is not used as a basis for placing an order.
The above content is all about "[XM Forex Official Website]: The low point of gold in the morning is a watershed, and the weekly support of European and American daily lines stops rising". It is carefully www.xmhouses.compiled and edited by the editor of XM Forex. I hope it will be helpful to your trading! Thanks for the support!
Share, just as simple as a gust of wind can bring refreshment, just as pure as a flower can bring fragrance. The dusty heart gradually opened, and I learned to share, sharing is actually so simple.
Disclaimers: XM Group only provides execution services and access permissions for online trading platforms, and allows individuals to view and/or use the website or the content provided on the website, but has no intention of making any changes or extensions, nor will it change or extend its services and access permissions. All access and usage permissions will be subject to the following terms and conditions: (i) Terms and conditions; (ii) Risk warning; And (iii) a complete disclaimer. Please note that all information provided on the website is for general informational purposes only. In addition, the content of all XM online trading platforms does not constitute, and cannot be used for any unauthorized financial market trading invitations and/or invitations. Financial market transactions pose significant risks to your investment capital.
All materials published on online trading platforms are only intended for educational/informational purposes and do not include or should be considered for financial, investment tax, or trading related consulting and advice, or transaction price records, or any financial product or non invitation related trading offers or invitations.
All content provided by XM and third-party suppliers on this website, including opinions, news, research, analysis, prices, other information, and third-party website links, remains unchanged and is provided as general market commentary rather than investment advice. All materials published on online trading platforms are only for educational/informational purposes and do not include or should be considered as applicable to financial, investment tax, or trading related advice and recommendations, or transaction price records, or any financial product or non invitation related financial offers or invitations. Please ensure that you have read and fully understood the information on XM's non independent investment research tips and risk warnings. For more details, please click here