


Trusted by over 15 Million Traders
The Most Awarded Broker
for a Reason
Easy Access to 1,400+ Global Assets
EURUSD
Euro vs U.S. Dollar
US500
S&P 500 (US500)
GOLD
Gold
COFFEE
US Coffee
Apple
Apple (AAPL.OQ)
-

Finance Magnates 颁发
-

Finance Magnates 颁发
-

Capital Finance International Magazine (CFI.co) 2024年颁赠
-

COLWMA 2024年颁赠
-

荣获World Finance Forex Awards 2023最佳外汇客户服务奖
-

荣获World Finance Forex Awards 2023欧洲最佳外汇经纪商奖
-

荣获World Finance Forex Awards 2023澳大拉西亚最佳外汇经纪商奖
-

荣获World Finance Forex Awards 2023拉丁美洲最佳外汇经纪商奖
-

荣获World Finance Forex Awards 2023中东最佳外汇经纪商奖
-

CFI.co于2023年颁赠
-

荣获2023年City of London Wealth Management Awards
-

荣获2022年埃及金融博览会颁赠
-

荣获2022年City of London Wealth Management Awards
-

CFI.co于2022年颁赠
-

荣获Global Forex Awards 2022 — 零售外汇 颁赠
-
2021年迪拜外汇博览会获颁赠
-

Ultimate Fintech 2021年颁赠
-

荣获2021年City of London Wealth Management Awards
-

FX168于2020年12月颁赠
-

荣获Global Business Awards 2020
-

荣获2020年City of London Wealth Management Awards
-

Capital Finance International Magazine (CFI.co)颁赠
-

Capital Finance International Magazine (CFI.co)颁赠
-

荣获2019年City of London Wealth Management Awards
-

Shares Magazine 授予 UK Forex Awards 2018
-

Capital Finance International Magazine (CFI.co)颁赠
-

Capital Finance International Magazine (CFI.co)颁赠
-

2017年伦敦财富管理奖
-

2016最佳本土 客户服务
-

中东和北非地区(MENA)增长最快的经纪商
-
2015年最佳外汇科技提供商
-
2014年最佳外汇科技提供商
-

2014年最佳外汇科技提供商
-

荣获 The Trading Show 2024年非洲 Africa Fintech 峰会颁赠
-

荣获2024年中东地区 Brokersview 颁赠
-
荣获2024年中东地区 Brokersview 颁赠
-

荣获2024年阿曼 Smart Vision 峰会颁赠
-

荣获2024年迪拜外汇博览会颁赠
-

荣获2024年迪拜 Forex Traders Summit 颁赠
-

2024年埃及 Smart Vision 峰会颁赠
-

投查查于2024年颁赠
-

Capital Finance International Magazine (CFI.co) 2024年颁赠
-

CFI.co于2023年颁赠
-

CFI.co于2023年颁赠
-

交易社区平台FOLLOWME于2022年颁赠
-
2022年迪拜Forex Expo获颁赠
-
2022年迪拜Forex Expo获颁赠
-

荣获Global Forex Awards 2022 — 零售外汇 颁赠
-

CFI.co于2022年颁赠
-

CFI.co于2022年颁赠
-

World Finance Forex Awards 2022 颁发
-

World Finance Forex Awards 2022 颁发
-

World Finance Forex Awards 2022 颁发
-

World Finance Forex Awards 2022 颁发
-
交易社区平台FOLLOWME于2021年颁赠
-

2021年埃及Smart Vision Investment Expo博览会获颁赠
-

CFI.co于2021年颁赠
-

CFI.co于2021年颁赠
-

荣获Global Forex Awards 2021 — 零售外汇 颁赠
-

荣获Global Forex Awards 2021 — 零售外汇 颁赠
-

World Finance 2021颁发
-

World Finance 2021颁发
-
FOLLOWME于2021年颁赠
-

Global Forex Awards 2021 — B2B 颁赠
-

Global Forex Awards颁赠
-

Global Forex Awards颁赠
-

CFI.co于2020年颁赠
-

CFI.co于2020年颁赠
-

荣获Global Business Awards 2020
-

World Finance Magazine 颁赠
World Finance Forex Awards 2020 -

World Finance Magazine 颁赠
World Finance Forex Awards 2020 -
FOLLOWME交易社区授予
-

Global Forex Awards颁赠
-

Global Forex Awards颁赠
-

FinTech Age Awards颁发
-

World Finance Magazine 颁赠
World Finance Forex Awards 2019 -

World Finance Magazine 颁赠
World Finance Forex Awards 2019 -

荣获 World Finance Forex Awards 2018 颁赠
-

荣获2018年埃及金融博览会颁赠
-

荣获 Shares Magazine 的 UK Forex Awards 2017 颁赠
-

荣获 World Finance Forex Awards 2017
-

2016年最佳黄金经纪商
-

2016年最佳外汇经纪商
-

2015年最佳本地客户服务
-

Global Brands Magazine 颁赠
-

Online Money Awards 2022 颁发
-

荣获2022年埃及金融博览会颁赠
-

2015最佳外汇交易平台
-

2015最佳金融交易平台
-

2013最佳创新外汇平台奖
-

2020年 Cyprus HR Awards 颁赠
-

金融行业的佼佼者
-

认证最优金牌级别
-

2014年首届亚军
-
Finance Magnates 颁发
-
Finance Magnates 颁发
-
Capital Finance International Magazine (CFI.co) 2024年颁赠
-
COLWMA 2024年颁赠
-
荣获World Finance Forex Awards 2023最佳外汇客户服务奖
-
荣获World Finance Forex Awards 2023欧洲最佳外汇经纪商奖
-
荣获World Finance Forex Awards 2023澳大拉西亚最佳外汇经纪商奖
-
荣获World Finance Forex Awards 2023拉丁美洲最佳外汇经纪商奖
-
荣获World Finance Forex Awards 2023中东最佳外汇经纪商奖
-
CFI.co于2023年颁赠
-
荣获2023年City of London Wealth Management Awards
-
荣获2022年埃及金融博览会颁赠
-
荣获2022年City of London Wealth Management Awards
-
CFI.co于2022年颁赠
-
荣获Global Forex Awards 2022 — 零售外汇 颁赠
-
2021年迪拜外汇博览会获颁赠
-
Ultimate Fintech 2021年颁赠
-
荣获2021年City of London Wealth Management Awards
-
FX168于2020年12月颁赠
-
荣获Global Business Awards 2020
-
荣获2020年City of London Wealth Management Awards
-
Capital Finance International Magazine (CFI.co)颁赠
-
Capital Finance International Magazine (CFI.co)颁赠
-
荣获2019年City of London Wealth Management Awards
-
Shares Magazine 授予 UK Forex Awards 2018
-
Capital Finance International Magazine (CFI.co)颁赠
-
Capital Finance International Magazine (CFI.co)颁赠
-
2017年伦敦财富管理奖
-
2016最佳本土 客户服务
-
中东和北非地区(MENA)增长最快的经纪商
-
2015年最佳外汇科技提供商
-
2014年最佳外汇科技提供商
-
2014年最佳外汇科技提供商
-
荣获 The Trading Show 2024年非洲 Africa Fintech 峰会颁赠
-
荣获2024年中东地区 Brokersview 颁赠
-
荣获2024年中东地区 Brokersview 颁赠
-
荣获2024年阿曼 Smart Vision 峰会颁赠
-
荣获2024年迪拜外汇博览会颁赠
-
荣获2024年迪拜 Forex Traders Summit 颁赠
-
2024年埃及 Smart Vision 峰会颁赠
-
投查查于2024年颁赠
-
Capital Finance International Magazine (CFI.co) 2024年颁赠
-
CFI.co于2023年颁赠
-
CFI.co于2023年颁赠
-
交易社区平台FOLLOWME于2022年颁赠
-
2022年迪拜Forex Expo获颁赠
-
2022年迪拜Forex Expo获颁赠
-
荣获Global Forex Awards 2022 — 零售外汇 颁赠
-
CFI.co于2022年颁赠
-
CFI.co于2022年颁赠
-
World Finance Forex Awards 2022 颁发
-
World Finance Forex Awards 2022 颁发
-
World Finance Forex Awards 2022 颁发
-
World Finance Forex Awards 2022 颁发
-
交易社区平台FOLLOWME于2021年颁赠
-
2021年埃及Smart Vision Investment Expo博览会获颁赠
-
CFI.co于2021年颁赠
-
CFI.co于2021年颁赠
-
荣获Global Forex Awards 2021 — 零售外汇 颁赠
-
荣获Global Forex Awards 2021 — 零售外汇 颁赠
-
World Finance 2021颁发
-
World Finance 2021颁发
-
FOLLOWME于2021年颁赠
-
Global Forex Awards 2021 — B2B 颁赠
-
Global Forex Awards颁赠
-
Global Forex Awards颁赠
-
CFI.co于2020年颁赠
-
CFI.co于2020年颁赠
-
荣获Global Business Awards 2020
-
World Finance Magazine 颁赠
World Finance Forex Awards 2020 -
World Finance Magazine 颁赠
World Finance Forex Awards 2020 -
FOLLOWME交易社区授予
-
Global Forex Awards颁赠
-
Global Forex Awards颁赠
-
FinTech Age Awards颁发
-
World Finance Magazine 颁赠
World Finance Forex Awards 2019 -
World Finance Magazine 颁赠
World Finance Forex Awards 2019 -
荣获 World Finance Forex Awards 2018 颁赠
-
荣获2018年埃及金融博览会颁赠
-
荣获 Shares Magazine 的 UK Forex Awards 2017 颁赠
-
荣获 World Finance Forex Awards 2017
-
2016年最佳黄金经纪商
-
2016年最佳外汇经纪商
-
2015年最佳本地客户服务
-
Global Brands Magazine 颁赠
-
Online Money Awards 2022 颁发
-
荣获2022年埃及金融博览会颁赠
-
2015最佳外汇交易平台
-
2015最佳金融交易平台
-
2013最佳创新外汇平台奖
-
2020年 Cyprus HR Awards 颁赠
-
金融行业的佼佼者
-
认证最优金牌级别
-
2014年首届亚军

Awarded BestBrokerYear After Year
CATEGORIES
News
- The pound 1.34 defense line sounds the "air raid alarm", and the "hawkish rebell
- Gold fluctuates again!
- As the growth spread widens, can the US dollar/Canada dollar hit 1.3778 again?
- US dollar index lowers under pressure, Milan "probably" taking office before the
- Non-agricultural aftershocks! The 10-year U.S. Treasury yield is on the verge of
market analysis
The golden range will only exert its strength after breaking through, and Europe and the United States will gain short-term support.
Wonderful introduction:
One person’s happiness may be fake, but the happiness of a group of people can no longer distinguish between true and false. They squandered their youth to their heart's content, wishing they could burn it all away. Their posture was like a carnival before the end of the world.
Hello everyone, today XM Forex will bring you "[XM Foreign Exchange Decision Analysis]: The gold range will not be strong until it breaks, and Europe and the United States will gain short-term support." Hope this helps you! The original content is as follows:
U.S. Dollar Index
In terms of the performance of the U.S. Dollar Index, the U.S. Dollar Index showed a volatile trend last Friday. The U.S. dollar index price climbed to a maximum of 99.075 that day, dropped to a minimum of 98.692, and finally closed at 98.917. Looking back at the overall market performance last Friday, the price first gained support and rose in the short term, then fell under pressure from the previous day's high, and finally ended with a cross on the day.
From a multi-cycle analysis, the weekly price has continued to fluctuate in the early stage but is generally supported by the key position of the weekly. The current weekly support is in the 98 area, and subsequent attention will be paid to further mid-term bulls (need to pay attention to the gap position). From the daily level, as time goes by, the current daily resistance is in the 98.85 area. This position is the key to the trend of the band. The short-term price will pierce it. The key is to follow up on whether the market can actually close below this position. Once it breaks down, focus on the pressure on the subsequent band. At the four-hour level, the price last Friday consolidated up and down at the four-hour key position, and at the same time pierced the daily support. The price is currently showing further downward trends, so focus on the resistance in the 98.90-99 range above and the 98.50-98.30 area below in the short term.
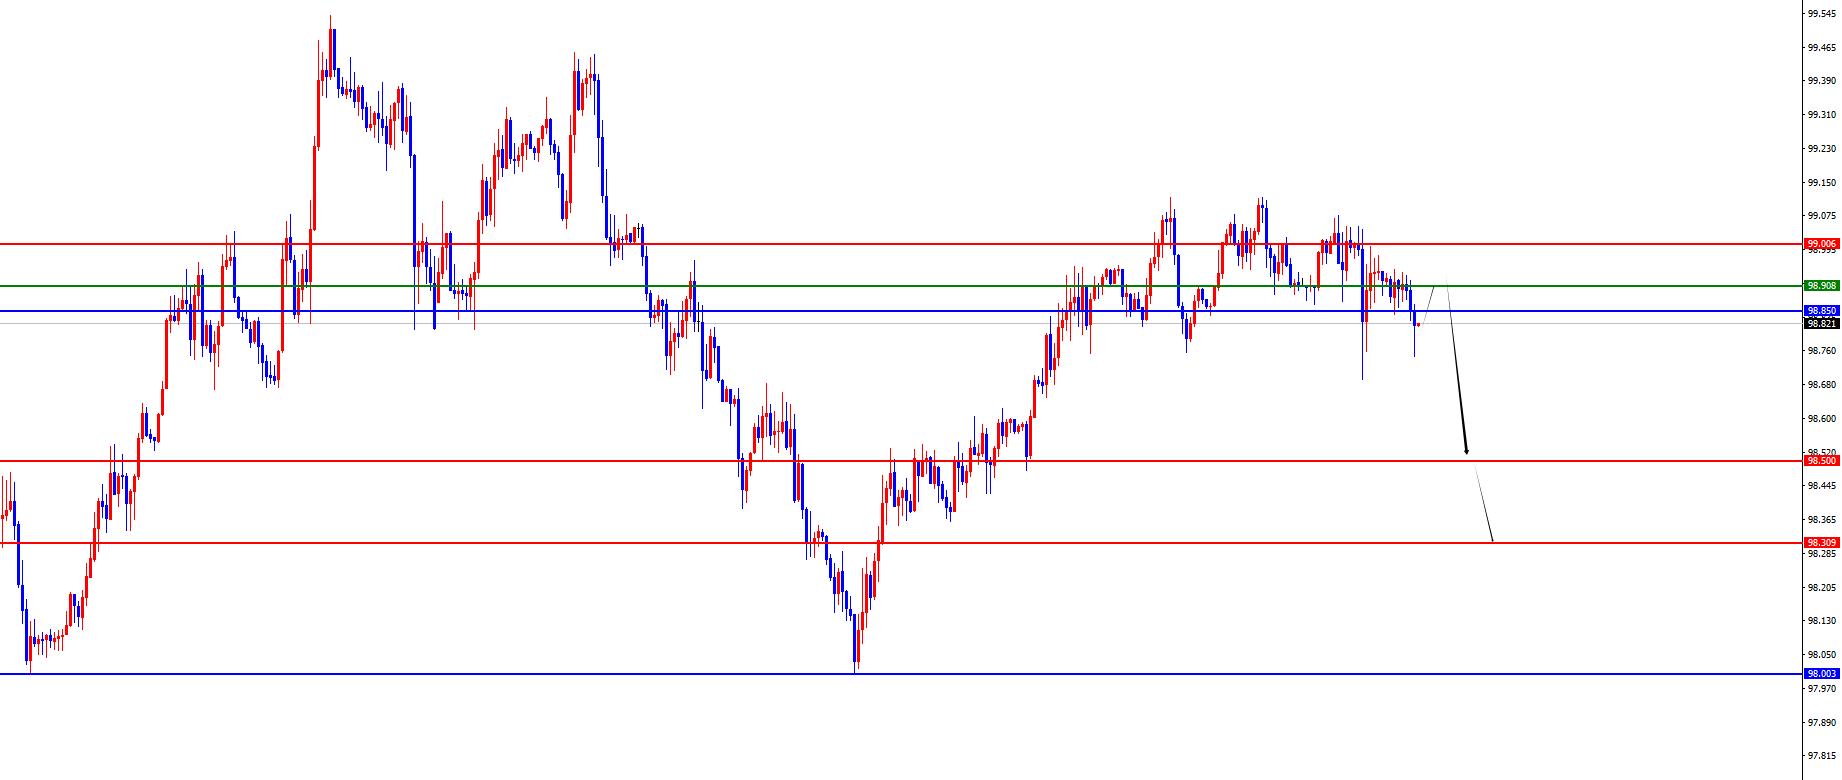
The U.S. index is short in the range of 98.90-99, defending 5 US dollars, and targeting 98.50-98.30
Gold
In terms of gold, the price of gold generally showed a decline last Friday. The highest price on the day rose to 4144, the lowest fell to 4044.01, and closed at 4112.79 positions. During the early trading last Friday, the price first came under pressure at the daily resistance position, and then broke through the four-hour support. After being supported before the U.S. market, the price rose again. In the end, it still ended with a negative line, but the lower lead closed below.
From a multi-cycle analysis, first observe the monthly rhythm. From a long-term perspective, the 3150 position is the watershed of the long-term trend. The price can be treated as long as it is above this position. From the perspective of the weekly level, the current watershed between long and short weekly lines is at 3707. The price can be treated as long as the midline is above this position. From the daily level, we need to pay attention to the 4141 area resistance for the time being. In the early rise, the low position after the price broke through the daily support became the key. Therefore, the current 4004 position is the key to whether the band can continue to fall. At the four-hour level, the price consolidated up and down at the four-hour key position last Thursday and Friday. The price currently tends to fluctuate in the 4004-4161 range, and we will pay attention to the continuation after breaking the range. In the short term, we will first focus on the resistance near the gap, the daily line and the shock high point of 4161. Therefore, we will treat it as a shock before breaking the range, and then pay attention to the continuation performance after breaking the range.
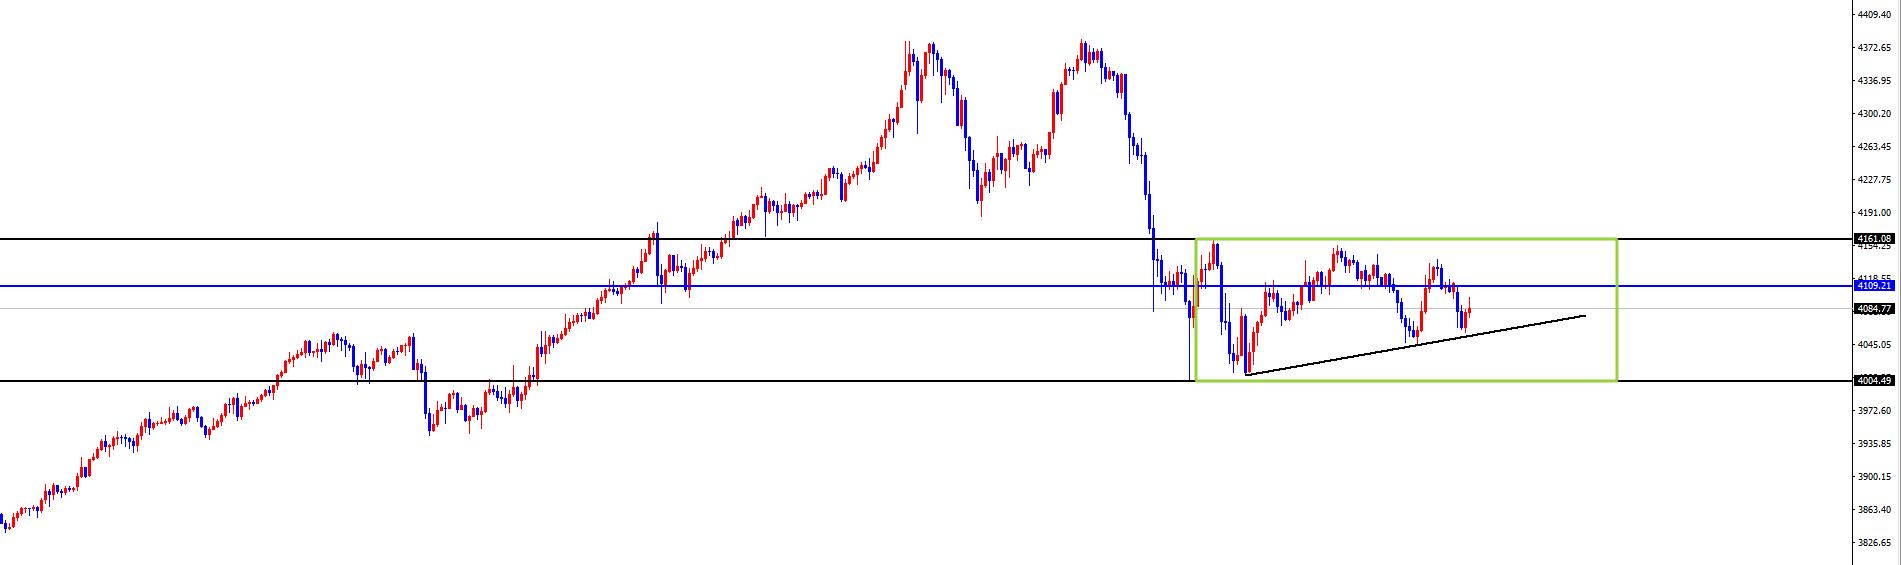
Gold is paying attention to the 4004-4161 range shock, and will follow the layout after the range breaks out
Europe and the United States
In Europe and the United States, European and American prices generally showed an increase last Friday. The price fell to a minimum of 1.1600 on that day, rose to a maximum of 1.1647, and closed at 1.1627. Looking back at the performance of the European and American markets last Friday, during the early trading period, the short-term price first ran within the daily resistance and four-hour support range. After the US market, the price broke through the daily resistance, and finally ended the day with a strong sun.
From a multi-cycle analysis, from the monthly level, Europe and the United States are supported at the 1.1100 position, so the price is treated as a long-term position above this position. From the weekly level, the weekly resistance is in the 1.1680 area. This position is the long-short watershed of the mid-line trend. The price below this position is treated as bearish in the mid-line. From the daily level, the daily line is the key for us to emphasize the band trend. The price broke through the resistance position of 1.1620 last Friday, and we will pay attention to the continued rise of the price. From the four-hour level, the price broke through the four-hour resistance position last Thursday night, and then continued to rise on Friday relying on the four-hour support. The current four-hour support is in the 1.1610 area, and the price will be bullish in the short term above this position. The price is fluctuating and rising in the short term on the hour, so temporarily focus on the four-hour support and daily support areas to see the upward trend, and the short-term focus on the 1.1650-1.1680 area above.
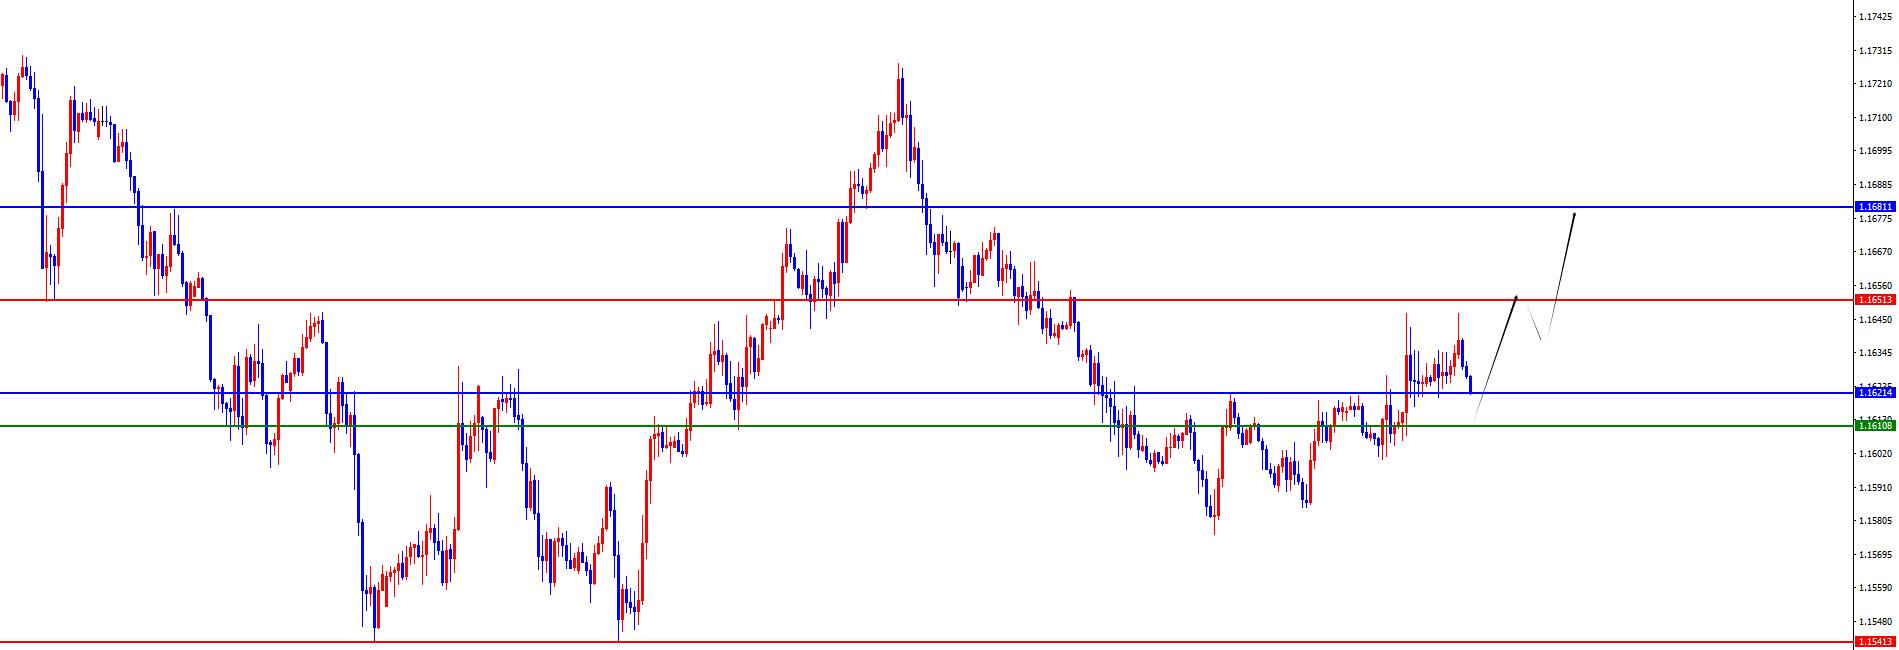
Europe and America have a lot of range 1.1610-20, defense 40 points, target 1.1650-1.1680
[Today’s key financial data and events] Monday, October 27, 2025
① To be determined, domestic refined oil products will open a new round of price adjustment window
② To be determined, the 2025 Financial Street Forum Year Will be held
③ To be determined: US President Trump’s visit to Japan
④16:15 RBA Chairman Bullock participates in fireside chat
⑤17:00 German October IFO Business Climate Index
⑥19:00 CBI Retail Sales Difference in the UK in October
⑦20:30 Monthly Durable Goods Orders in the US in September
⑧22:30 Dallas Fed Business Activity Index in the US in October
Note: The above is only a personal opinion strategy, for reference and www.xmhouses.communication only. It does not give customers any investment advice, has nothing to do with their investment, and is not a basis for placing orders.
The above content is all about "[XM Foreign Exchange Decision Analysis]: The golden range will be strong only after it breaks, and Europe and the United States will gain support in the short term". It is carefully www.xmhouses.compiled and edited by the editor of XM Foreign Exchange. I hope it will be helpful to your trading! Thanks for the support!
Every successful person has a beginning. Only by having the courage to start can you find the way to success. Read the next article now!
Disclaimers: XM Group only provides execution services and access permissions for online trading platforms, and allows individuals to view and/or use the website or the content provided on the website, but has no intention of making any changes or extensions, nor will it change or extend its services and access permissions. All access and usage permissions will be subject to the following terms and conditions: (i) Terms and conditions; (ii) Risk warning; And (iii) a complete disclaimer. Please note that all information provided on the website is for general informational purposes only. In addition, the content of all XM online trading platforms does not constitute, and cannot be used for any unauthorized financial market trading invitations and/or invitations. Financial market transactions pose significant risks to your investment capital.
All materials published on online trading platforms are only intended for educational/informational purposes and do not include or should be considered for financial, investment tax, or trading related consulting and advice, or transaction price records, or any financial product or non invitation related trading offers or invitations.
All content provided by XM and third-party suppliers on this website, including opinions, news, research, analysis, prices, other information, and third-party website links, remains unchanged and is provided as general market commentary rather than investment advice. All materials published on online trading platforms are only for educational/informational purposes and do not include or should be considered as applicable to financial, investment tax, or trading related advice and recommendations, or transaction price records, or any financial product or non invitation related financial offers or invitations. Please ensure that you have read and fully understood the information on XM's non independent investment research tips and risk warnings. For more details, please click here